What was built with Claude Code
- xgxr — fixed a user-reported bug and got the package to CRAN.
- xgx — rebuilt the website to publish by continuous integration.
- synpmx — a package for generating synthetic pharmacometrics datasets.
- TCE-IPDE — a specification for simulating intrapatient dose escalation.
1. xgxr: User reported a bug
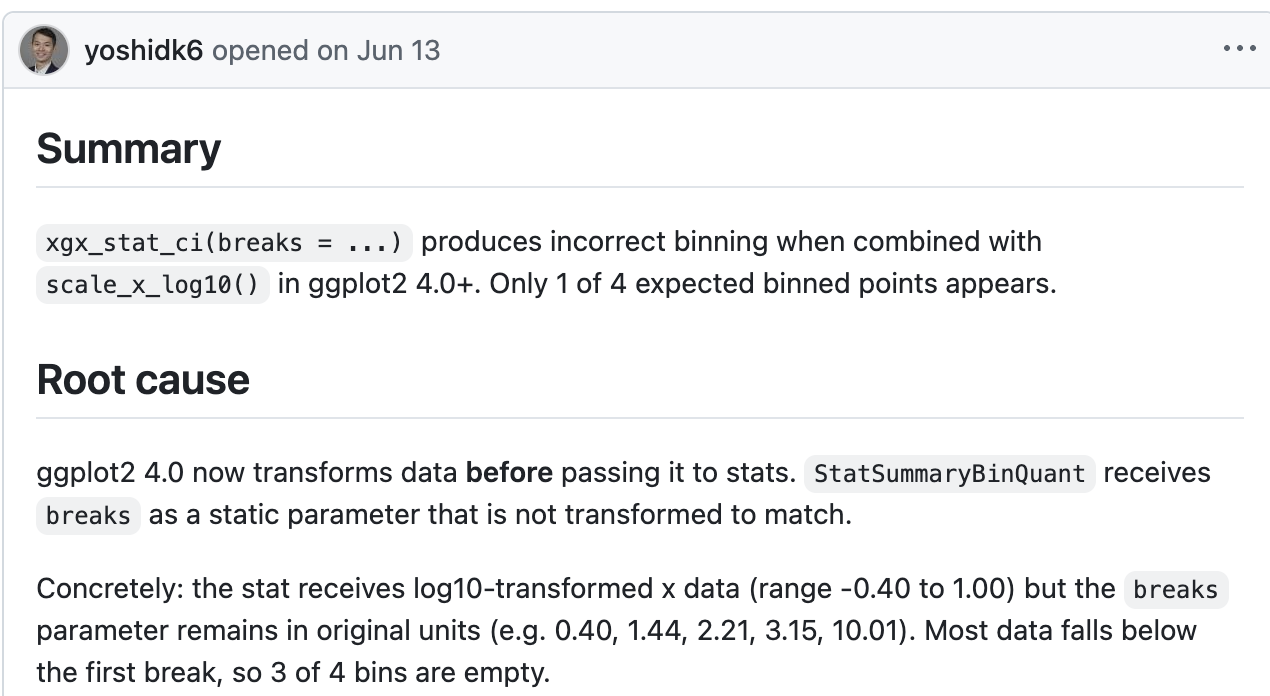
![GitHub issue 72 reporting that xgx_stat_ci breaks produces incorrect binning with scale_x_log10 in ggplot2 4.0 and later.]()
1. xgxr: Source of bug was using a hand-copied “fork” of ggplot2 function
xgxr::StatSummaryBinQuant is a hand-copied fork of ggplot2’s stat-summary-bin.R, pinned in its roxygen block to ggplot2 commit 351eb41. It never picked up a transform step ggplot2 added later.- In this old version it had:
breaks <- breaks
- ggplot2 since changed with
breaks <- scales[[x]]$transform(breaks)
1. xgxr: Fixed bug and got package ready for CRAN
- Fixed bug and then updated xgxr to 1.1.6 to CRAN (first update in 3 years)
- All CRAN checks, warnings, and notes were handled by Claude.
- Along the way it noticed a hyperlink whose TLS certificate had expired, which is the kind of thing CRAN rejects a submission for, and removed it unasked
2. xgx using Continuous Integration
Continuous Integration (CI) via GitHub Actions publishes the site.
- xgx was our open source website and we built it using dozens of .html files committed to github.
- A better way to work is with continuous integration (CI) that builds the site after every push so the code is in the github repository but the html is not.
- Github Actions does this and Claude Code set this up for me.
- I am not a Github expert. In the past I relied on experts for help, but now I can quit bugging Matt and do a lot myself.
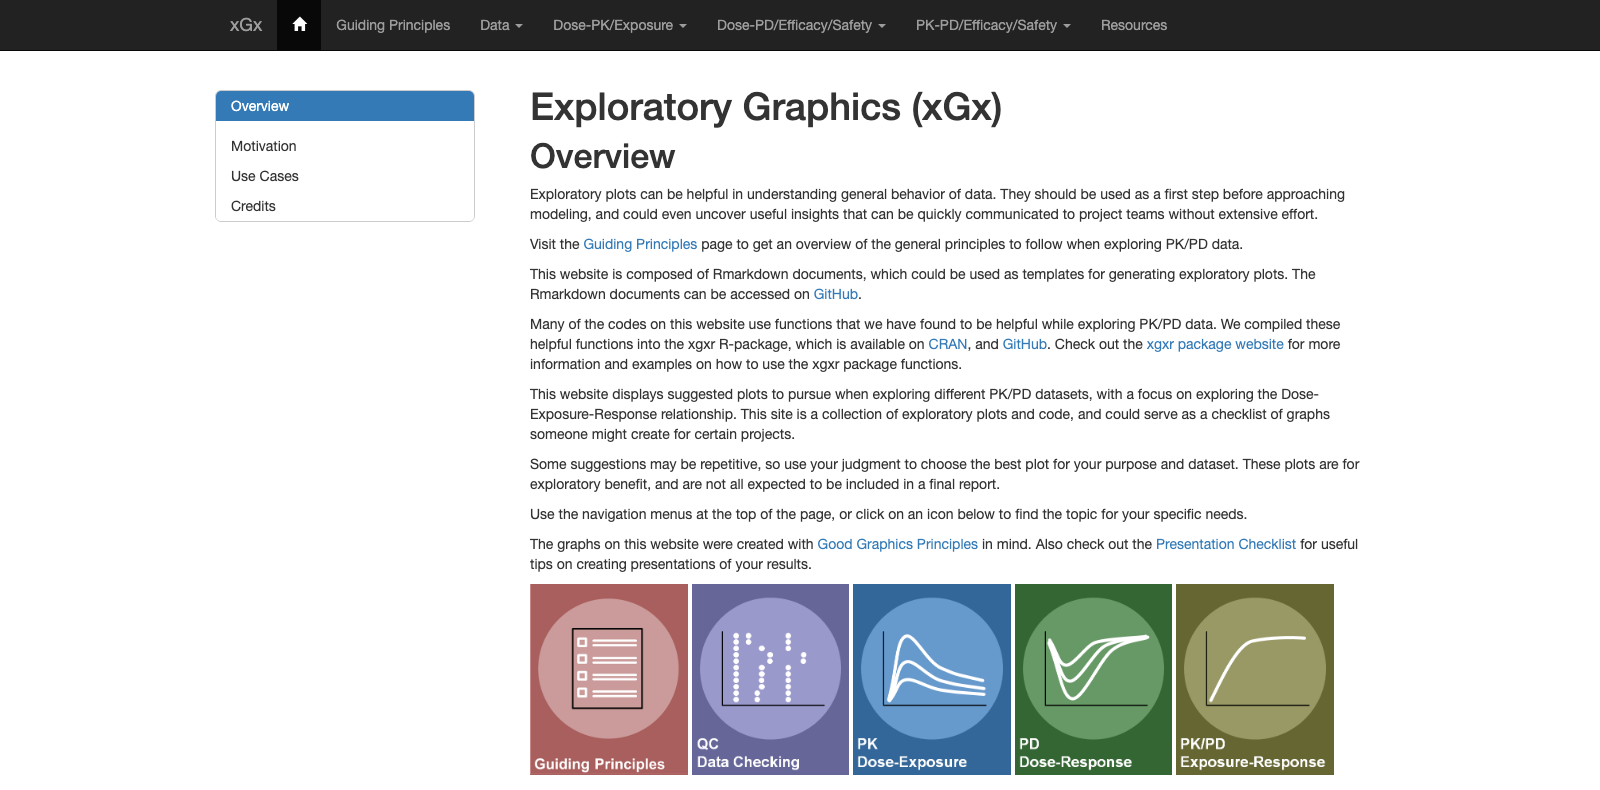
opensource.nibr.com/xgx
![The xGx website: navigation bar, the Exploratory Graphics overview, and the row of topic icons.]()
3. synpmx: Package for Generating Synthetic Pharmacometrics Datasets
Allows for workflows, teaching material and tooling can be developed and shared without exposing real clinical data.
This is still a work in progress, with three different synthetic data generators explored so far, each with their own strengths.
- PMX models
- Principle Component Analysis PCA
- AVATAR - Patient blending
3. synpmx: Most useful aspects; building a scorecard and a set of datasets to test
- 8 public datasets used to test the generator — warfarin, theophylline, mavoglulant, etc., from nlmixr2data and xgxr package.
- A scorecard and a set of graphical checks for evaluating the synthetic data
The above lets me tell if the syntehtic data looks reasonable.
Once I have an algorithm that works well and the process as acceptable by data privacy, I can validate the code. Thus far, it’s all been “vibe-coded” with Claude Code.
It’s very helpful having a working prototype for building my own understanding for discussing with others.
4. Exploring Strategic Questions
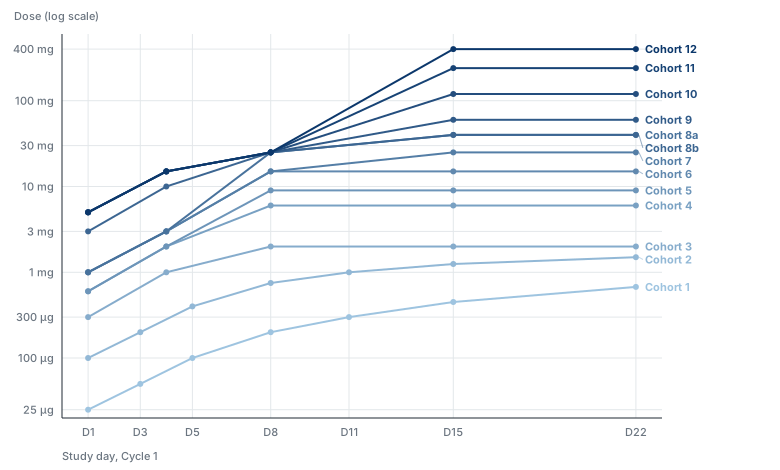
Does intra-patient dose escalation reach a confirmable active dose sooner in a first-in-human T-cell engager trial?
![MCLA-117 Cycle 1 dose escalation. Each line is one cohort's within-patient ladder, on a log dose axis from 25 micrograms to 400 milligrams.]()
MCLA-117: a published within-patient ladder, 25 µg to 400 mg, transcribed from the EHA 2020 poster.
4. Output is currently a specification.
A specification, a reading queue, and a references page marking, for every source, whether the claim drawn from it had been checked against the source.
Working specification
I’m reading/thinking more about the difference between “vibe-coding” vs “agentic-engineering”, the latter meaning to think more about the analysis plan before building a tool. Guide for creating working specifications
Workflow for building website for task
- For an R package, use
pkgdown. For anything else, use a site made by quarto_render().
- Sites are published by Continuous Integration (CI) through GitHub Actions.
- I read the rendered output — on my phone, at home, or at work.
- Claude sets all of that up with minimal work from me.
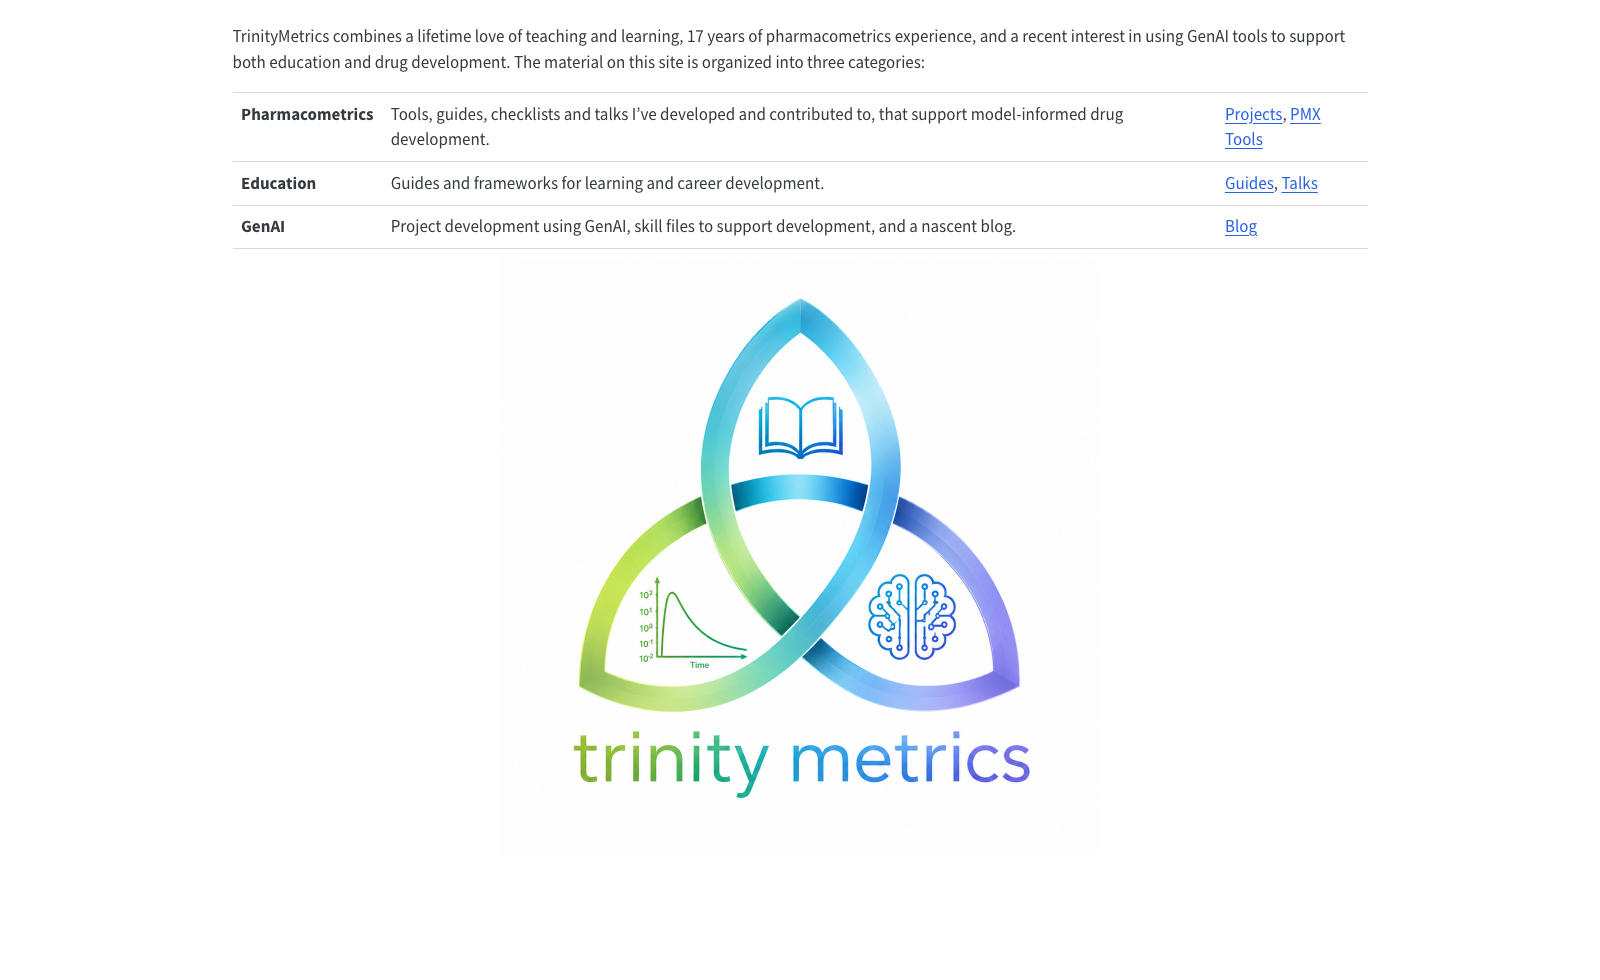
I’ve set up the TrinityMetrics repository for this.
![The TrinityMetrics site: navigation bar, the three-category table, and the triquetra logo with the trinity metrics wordmark.]()
Getting access
Running Claude directly at claude.ai is blocked until you have done the short internal training that is linked to whenever you hit the block.