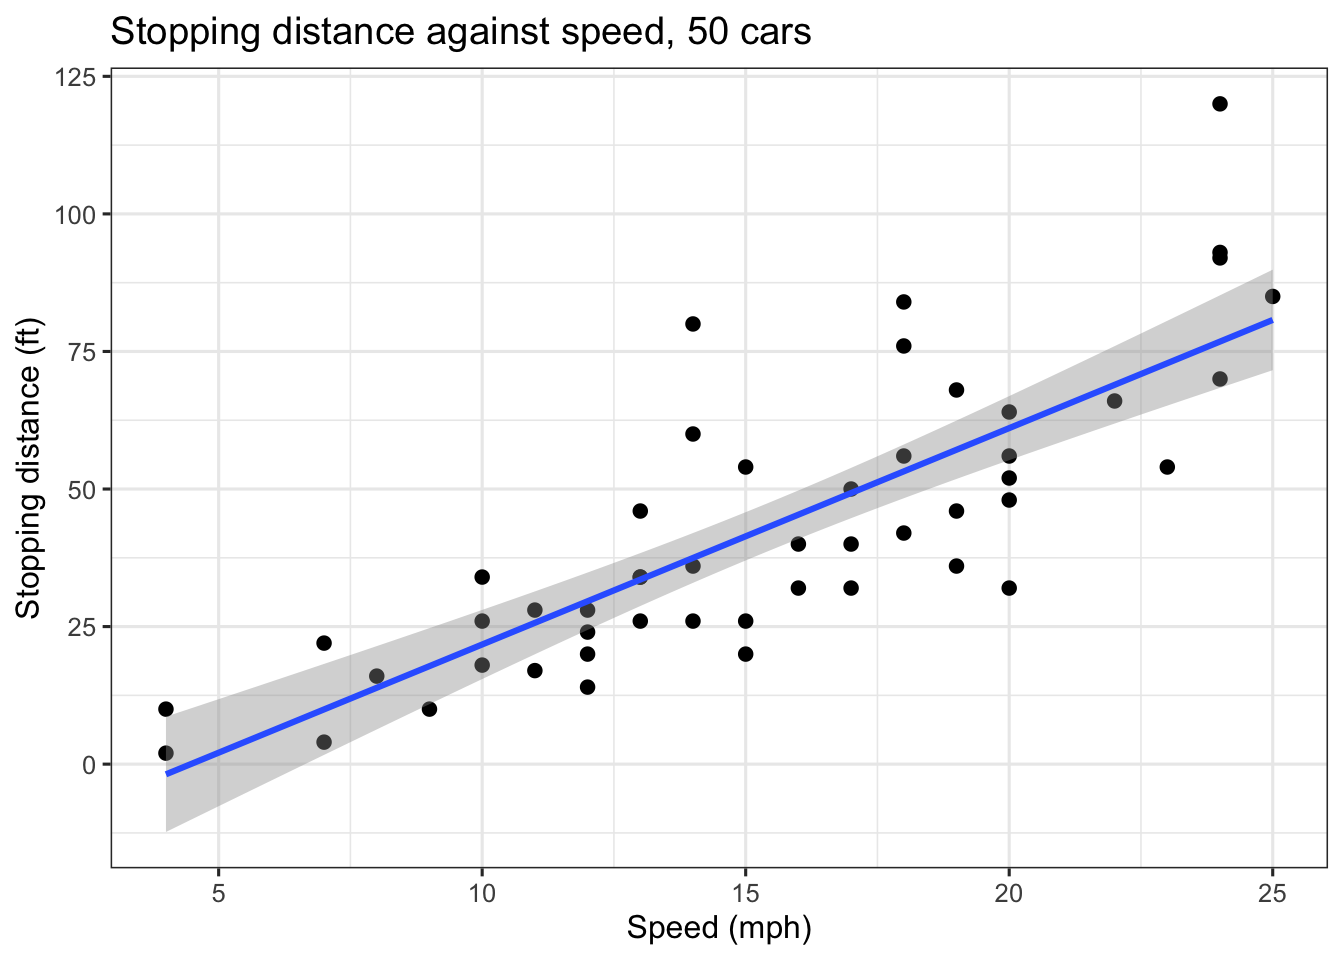
The built-in R dataset cars plotted: stopping distance against speed for 50 cars, with a least-squares fit.
Published
September 9, 2026
cars is one of R’s built-in datasets. It holds two measurements on each of 50 cars recorded in the 1920s: speed, in miles per hour, and dist, the distance in feet the car took to stop from that speed.
library(ggplot2)ggplot(cars, aes(speed, dist)) +geom_point(size =2) +geom_smooth(method ="lm", formula = y ~ x) +labs(x ="Speed (mph)", y ="Stopping distance (ft)",title ="Stopping distance against speed, 50 cars") +theme_bw(base_size =12)
The line is an ordinary least-squares fit of distance on speed, and the band around it is the 95% confidence interval on that fit.