flowchart LR
    A["Recovery tail<br/>days 150 to 300"] --> K["k_out"]
    B["Speed of the fall<br/>days 0 to 3"] --> KE["k_out × Emax"]
    C["When recovery starts<br/>days 80 to 140"] --> R["Emax / EC50"]
    K --> KE
    KE --> E["Emax"]
    E --> R
    R --> EC["EC50"]
Why EC50 is hard to estimate for a B-cell depleting agent
Where the information about Emax and EC50 lives in an indirect-response model, and what a study has to contain to see it
pharmacometrics
identifiability
immunology
working document
For a drug that depletes circulating B cells through an indirect-response model, the Emax and EC50 of the drug effect are separately identifiable only from the first days of depletion and from cohorts sitting in a narrow concentration band far below therapeutic exposure. This document derives that, simulates it, and checks it against the published models.
The simulations here run on every render and the published numbers do not. Everything computed on this page comes from the code chunks in it, with parameter values chosen to resemble published models and stated where they are chosen. The published estimates in Section 8 were transcribed from the papers by a fetch tool and carry ⚠️ in references.qmd; the theory sources are from abstracts and carry ❌. The project index lists the other documents in this folder. This project grew out of Section 6.2 of the ITP-PK-Platelet specification.
In brief
The question. A monoclonal antibody depletes circulating B cells. The standard model is an indirect response with the drug raising the B-cell loss rate through \(E_{\max} C / (EC_{50} + C)\). Published fits of this model report \(E_{\max}\) near 150, and either report \(EC_{50}\) with a wide interval, or fix it, or give up on it and fit a slope instead. Is \(EC_{50}\) estimable at all, and if so from what?
The answer. ⚠️ \(EC_{50}\) is estimable only through \(E_{\max}\), and \(E_{\max}\) is estimable only from the first days of depletion or from a cohort held in a concentration band two orders of magnitude below \(EC_{50}\). With a first post-dose B-cell sample at a week and doses that deplete completely, the two parameters are perfectly correlated and only their ratio is identified. Three quantities in the data carry three pieces of information: the recovery tail carries \(k_{\rm out}\); the speed of the initial fall carries \(k_{\rm out} E_{\max}\); the timing of the recovery’s start carries \(E_{\max}/EC_{50}\). Lose the first days, and the second piece is gone, and \(E_{\max}\) and \(EC_{50}\) collapse onto one ridge. Section 2 derives each of these from the model equation, Section 5 shows them in the sensitivities, and Section 6 puts numbers on them by design.
Why a large \(E_{\max}\) makes it worse. The nadir is \(B_0/(1 + E)\). With \(E_{\max} = 150\), the count at \(C = EC_{50}\) is already 1.3% of baseline, below any flow-cytometry limit. Half-maximal depletion happens at \(C \approx EC_{50}/150\). The concentration band over which the cell count can say anything about \(EC_{50}\) separately from \(E_{\max}\) is therefore far below every therapeutic dose, and usually below the PK assay. Section 4.
What to do instead. Parameterize the drug effect as the slope \(S_0 = E_{\max}/EC_{50}\), which is what Schoemaker et al. proposed in 1998 for exactly this situation and what the inebilizumab model did in 2022, and test the \(E_{\max}\) form only when a cohort has a quantifiable nadir. Section 9. Everything downstream that depends on the duration of depletion depends on the slope and \(k_{\rm out}\), and loses nothing.
Out of scope, stated once.
- ❌ Target-mediated drug disposition. The PK here is linear. Where a published model ties the effect to receptor occupancy with a binding constant fixed from in vitro data, that is a different route to the same place and Section 8 notes it.
- ❌ Tissue B cells. Only the circulating count is modelled, because only it is measured.
- ❌ Any recommendation about a named drug’s dose. The compounds in Section 8 are sources of parameter values and of what happened when the model was fit.
1. The model
An indirect response model of the fourth Jusko type: the drug stimulates the loss of the response variable. With \(B\) the circulating B-cell count,
\[ \frac{dB}{dt} = k_{\rm in} - k_{\rm out}\,\big(1 + E(C)\big)\,B, \qquad E(C) = \frac{E_{\max}\, C}{EC_{50} + C}, \qquad B(0) = B_0 = \frac{k_{\rm in}}{k_{\rm out}} \]
and one-compartment PK after an intravenous bolus, \(C(t) = (D/V) e^{-k_e t}\).
| Symbol | What it is | Value used here | Why that value |
|---|---|---|---|
| \(B_0\) | Baseline B-cell count | 200 cells/µL | Typical adult; ofatumumab model 194, inebilizumab 135 |
| \(k_{\rm out}\) | B-cell loss rate; sets the repopulation speed | 0.02 per day | Half-life 35 d; ofatumumab 0.0124/d, paediatric rituximab CD19 half-life 173 d |
| \(E_{\max}\) | Maximum fold-increase in loss rate | 150 | Ofatumumab 159, paediatric rituximab 155 |
| \(EC_{50}\) | Concentration for half of \(E_{\max}\) | 1 mg/L | Arbitrary scale; only \(C/EC_{50}\) enters |
| \(V\), \(CL\) | Volume, clearance | 3 L, 0.2 L/day | Half-life 10.4 d, an IgG1 antibody |
| LOQ | Flow-cytometry limit for B cells | 5 or 10 cells/µL | 2.5% or 5% of baseline |
| \(\sigma\) | Proportional residual error | 30% | Inebilizumab model 61%, ofatumumab lower; 30% is generous to the design |
The published values are in references.qmd, entries 5 to 8, transcribed and not verified.
library(ggplot2); library(dplyr); library(tidyr); library(xgxr); library(rxode2)
library(patchwork)
set.seed(20260909); xgx_theme_set()
knitr::opts_chunk$set(fig.height = 4, fig.width = 6.5)
# Palette: the first three categorical slots of the reference palette in the
# dataviz skill, documented as validated for all pairs; a single-hue ramp for dose.
pal3 <- c("#2a78d6", "#eb6834", "#1baf7a")
ramp5 <- c("#c6dbef", "#9ecae1", "#6baed6", "#3182bd", "#08519c")

Emax <- 150; EC50 <- 1; kout <- 0.02; B0 <- 200; V <- 3; CL <- 0.2

# The model: one-compartment PK after an IV bolus into A, and B cells made at
# kout * B0 and lost at kout * (1 + E(C)). slope = 1 swaps the Emax drug effect
# for the log-linear slope form used in Section 9.
bcell <- rxode2({
  C <- A / V
  if (slope == 1) {
    E <- S * log(1 + C / Cref)
  } else {
    E <- Emax * C / (EC50 + C)
  }
  d/dt(A) <- -CL / V * A
  B(0) <- B0
  d/dt(B) <- kout * B0 - kout * (1 + E) * B
})

# B-cell count at the requested times after a single dose. Tight tolerances,
# because Sections 5 and 6 take finite differences of the output.
sim_B <- function(dose, Emax, EC50, kout, B0 = 200, times,
                  form = "emax", S = 0, Cref = 1) {
  ev <- et(amt = dose, cmt = "A") %>% et(times)
  p <- c(Emax = Emax, EC50 = EC50, kout = kout, B0 = B0, V = V, CL = CL,
         slope = as.numeric(form == "slope"), S = S, Cref = Cref)
  out <- rxSolve(bcell, p, ev, atol = 1e-12, rtol = 1e-10, returnType = "data.frame")
  out$B[match(times, out$time)]
}
2. Which part of the curve carries which parameter
After a single depleting dose, the B-cell curve has five parts, and each is set by one parameter or one combination of parameters: the baseline by \(B_0\), the fall by \(k_{\rm out}(1 + E_{\max})\), the floor by \(E_{\max}\), the time the count climbs back by \(S_0 = E_{\max}/EC_{50}\), and the tail by \(k_{\rm out}\). No part is set by \(EC_{50}\) alone.
f_loq <- 0.05; ke <- CL / V; S0 <- Emax / EC50

# A: the model, drawn
pA <- ggplot() +
  annotate("rect", xmin = c(0.7, 2.7), xmax = c(1.3, 3.3), ymin = 1.7, ymax = 2.3, fill = "grey88", colour = "grey40") +
  annotate("text", x = c(1, 3), y = 2, label = c("C", "B"), size = 6) +
  annotate("segment", x = c(1, 1, 3, 3), xend = c(1, 1, 3, 3), y = c(3, 1.7, 3, 1.7), yend = c(2.3, 1, 2.3, 1),
           arrow = arrow(length = unit(2, "mm"))) +
  annotate("text", x = c(1.08, 0.92, 3.08, 3.08), y = c(2.65, 1.35, 2.65, 1.35), hjust = c(0, 1, 0, 0), size = 3.2, parse = TRUE,
           label = c("Dose", "k[e] == CL/V", "k[out]*B[0]", "k[out]*(1 + E(C))")) +
  annotate("curve", x = 1.3, y = 1.85, xend = 2.95, yend = 1.3, linetype = 2, curvature = 0.25,
           arrow = arrow(length = unit(2, "mm")), colour = "grey40") +
  annotate("text", x = 1.9, y = 0.85, parse = TRUE, size = 3.2,
           label = "E(C) == frac(E[max]*C, EC[50] + C)") +
  coord_cartesian(xlim = c(0, 4.5), ylim = c(0.5, 3.1)) + theme_void() +
  labs(title = "A. Model")

# B: the five parts on one curve
d_short <- seq(0, 3, by = 0.01); d_long <- seq(0, 300, by = 1)
panels <- c("First 3 days", "Days 0 to 300")
cur <- bind_rows(
  data.frame(panel = panels[1], day = d_short, B = sim_B(300, Emax, EC50, kout, B0, times = d_short)),
  data.frame(panel = panels[2], day = d_long,  B = sim_B(300, Emax, EC50, kout, B0, times = d_long)))
cur$panel <- factor(cur$panel, levels = panels)
t_half_fall <- log(2) / (kout * (1 + Emax)); B_floor <- B0 / (1 + Emax)
t_f <- log(f_loq * S0 * 100 / (1 - f_loq)) / ke
pf <- function(x) factor(x, levels = panels)
labB <- data.frame(panel = pf(panels[c(1, 1, 1, 2, 2)]),
  day = c(0.12, t_half_fall + 0.12, 1.2, t_f + 8, 190), B = c(230, 100, B_floor * 0.7, 7, 120), hjust = c(0, 0, 0, 0, 0),
  lab = c('"1  baseline:"~B[0]', '"2  fall: rate"~k[out]*(1+E[max])', '"3  floor:"~B[0]/(1+E[max])',
          '"4  climb back:"~E[max]/EC[50]', '"5  tail: rate"~k[out]'))
pB <- ggplot(cur, aes(day, B)) +
  geom_hline(yintercept = f_loq * B0, linetype = 2, colour = "grey50") +
  geom_hline(data = data.frame(panel = pf(panels[1])), aes(yintercept = B_floor), linetype = 3, colour = "grey50") +
  geom_line(linewidth = 0.8, colour = pal3[1]) +
  geom_point(data = data.frame(panel = pf(panels), day = c(t_half_fall, t_f), B = c(B0 / 2, f_loq * B0)),
             size = 2.5, colour = pal3[2]) +
  geom_text(data = labB, aes(label = lab, hjust = hjust), parse = TRUE, size = 3) +
  scale_y_log10(breaks = c(1, 10, 100), limits = c(0.8, 300)) +
  facet_wrap(~ panel, scales = "free_x") +
  labs(x = "Day", y = "B cells per µL, log scale", title = "B. Five parts of the curve")

# C: climb-back time across doses, simulated and from the formula
t_climb <- function(dose, Emax, EC50) {
  tt <- seq(0, 600, by = 0.5); B <- sim_B(dose, Emax, EC50, kout, B0, times = tt)
  i <- which.min(B); if (B[i] >= f_loq * B0) return(NA)
  tt[i - 1 + which(B[i:length(B)] >= f_loq * B0)[1]]
}
sets <- data.frame(Emax = c(50, 150, 450, 150), EC50 = c(1/3, 1, 3, 10))
sets$set <- sprintf("Emax %g, EC50 %.2g", sets$Emax, sets$EC50)
sets$S0 <- sprintf("Emax/EC50 = %g", sets$Emax / sets$EC50)
cc <- 10^seq(-0.5, 3, by = 0.25)
climb <- bind_rows(lapply(seq_len(nrow(sets)), function(k)
  data.frame(sets[k, ], cmax = cc, t = sapply(cc * V, t_climb, Emax = sets$Emax[k], EC50 = sets$EC50[k]))))
climb$set <- factor(climb$set, levels = sets$set)
lines_C <- bind_rows(lapply(unique(sets$Emax / sets$EC50), function(s0)
  data.frame(S0 = sprintf("Emax/EC50 = %g", s0), cmax = cc, t = log(f_loq * s0 * cc / (1 - f_loq)) / ke))) %>%
  filter(t > 0)
pC <- ggplot(climb, aes(cmax, t, colour = S0)) +
  geom_line(data = lines_C, linewidth = 0.8) +
  geom_point(aes(shape = set), size = 2.2) +
  scale_colour_manual(values = pal3[1:2], name = NULL) +
  scale_shape_manual(values = c(1, 16, 2, 15), name = NULL) +
  scale_x_log10() +
  labs(x = "Cmax, mg/L, log scale", y = "Day the count climbs above 5%", title = "C. Dose escalation") +
  theme(legend.position = "right", legend.text = element_text(size = 8))

(pA | pC) / pB + plot_layout(heights = c(1, 1.1))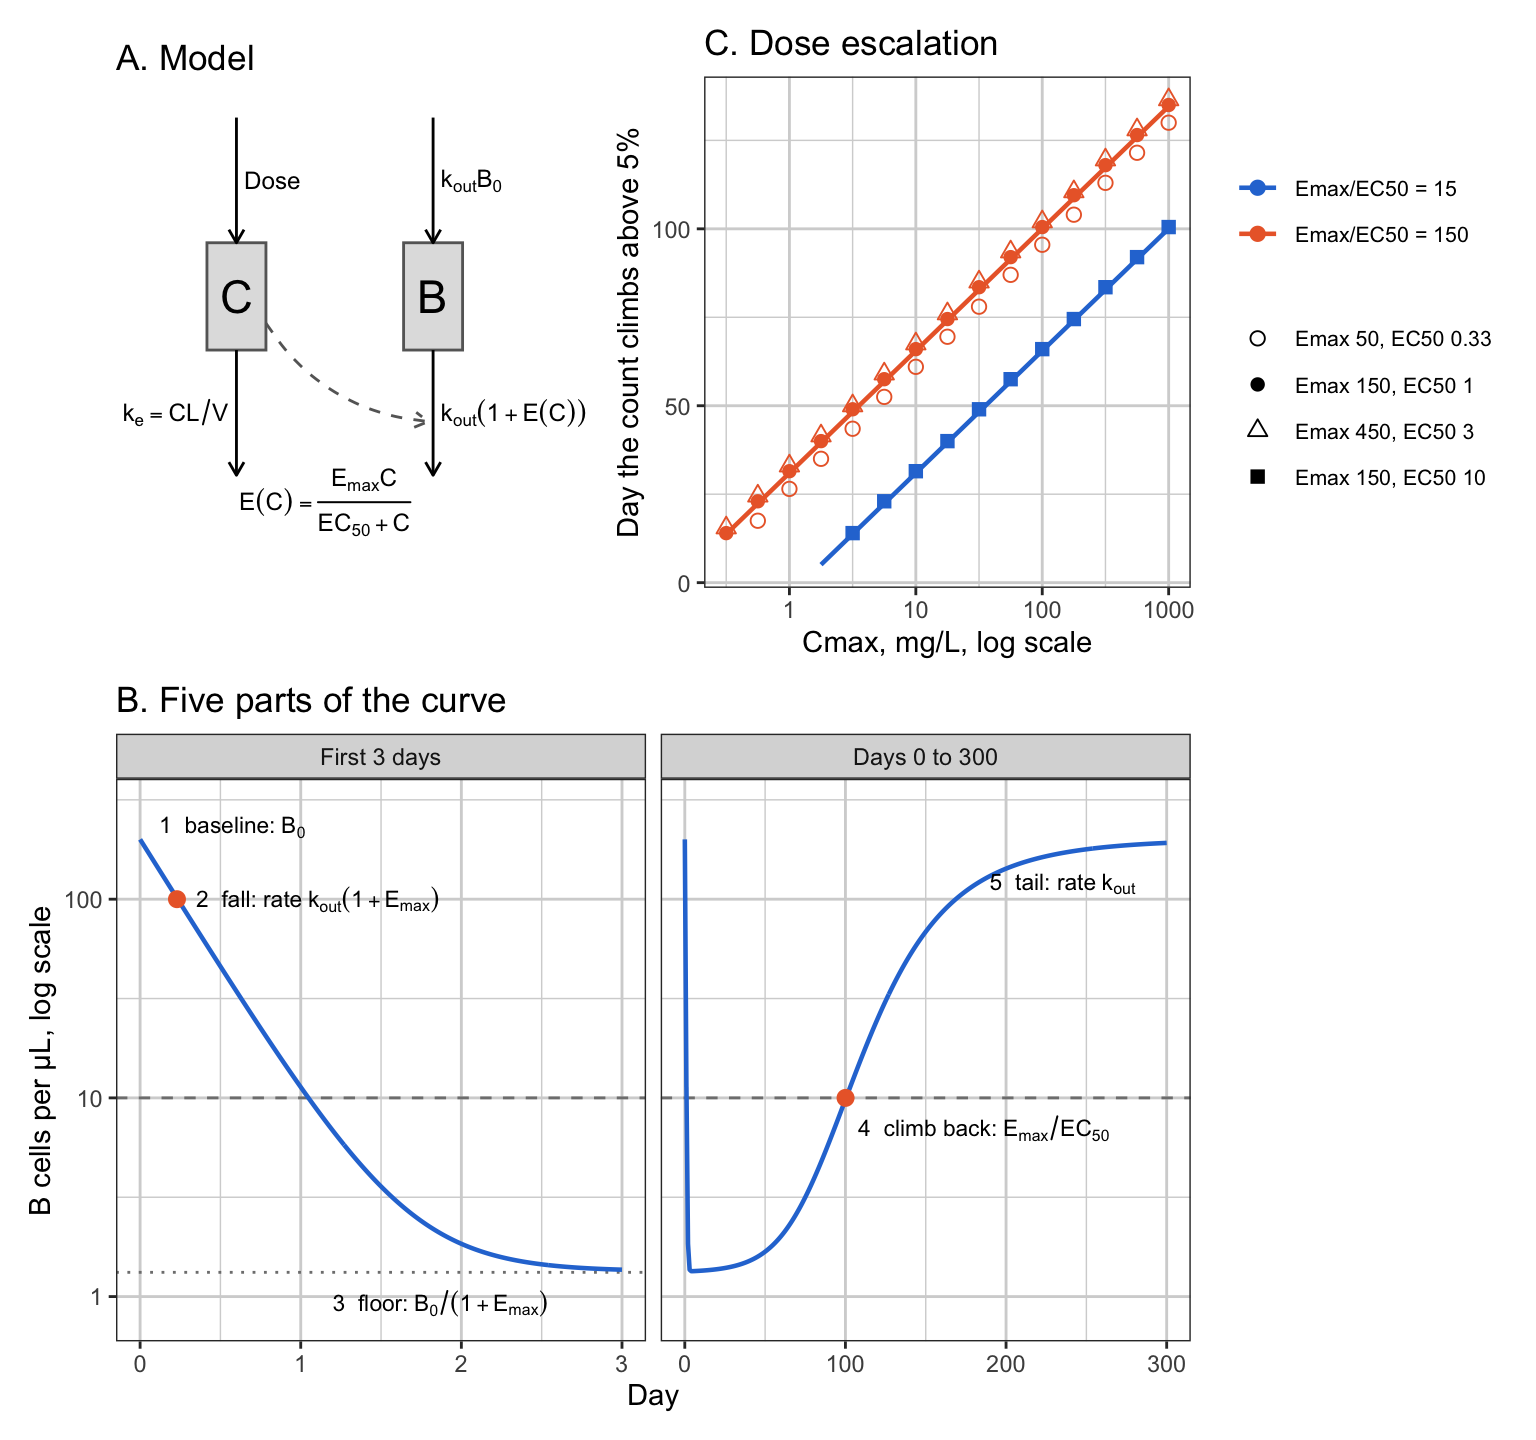
| Part | When | Formula | Carries |
|---|---|---|---|
| 1. Baseline | before the dose, and long after | \(B = B_0\) | \(B_0\) |
| 2. Fall | first one to two days | \(t_{1/2,\rm fall} \approx \dfrac{\ln 2}{k_{\rm out}(1 + E_{\max})}\) | \(k_{\rm out}(1 + E_{\max})\) |
| 3. Floor | while \(C \gg EC_{50}\) | \(B \approx \dfrac{B_0}{1 + E_{\max}}\) | \(E_{\max}\) |
| 4. Climb back | when \(E(C)\) falls to \((1-f)/f\) | \(t_f \approx \dfrac{1}{k_e} \ln \dfrac{f\, S_0\, C_{\max}}{1 - f}\) | \(S_0 = E_{\max}/EC_{50}\) |
| 5. Tail | once \(S_0 C \ll 1\) | \(B_0 - B \propto e^{-k_{\rm out} t}\) | \(k_{\rm out}\) |
| Low dose | \(C_{\max} \ll EC_{50}\) throughout | nadir depth \(\approx S_0 C_{\max} (k_{\rm out}/k_e)^{k_e/(k_e - k_{\rm out})}\) | \(S_0\), \(k_{\rm out}\) |
2.1 Two rates decide the shape
Dividing the model equation of Section 1 by \(B\) gives
\[ \frac{d \ln B}{dt} = k_{\rm out} \left( \frac{B_0}{B} - 1 - E(C) \right) \]
At any fixed concentration this pulls \(B\) toward its quasi-steady state \(B_{\rm qss} = B_0 / (1 + E(C))\), the level at which the bracket is zero, at the rate \(k_{\rm out}(1 + E(C))\). The concentration itself falls at the rate \(k_e = CL/V\). Which of the two rates is larger decides whether \(B\) keeps up with the drug:
- \(k_{\rm out}(1 + E) \gg k_e\): \(B\) follows \(B_{\rm qss}\), and its level at any time is fixed by the concentration at that time.
- \(k_{\rm out}(1 + E) \ll k_e\): \(B\) lags the drug, and its return is limited by its own turnover.
The first rate changes by a factor of \(1 + E_{\max}\) over the course of one dose. With the values of Section 1 it is \(k_{\rm out}(1 + E_{\max}) = 3.0\) per day at the start, 45 times \(k_e = 0.067\) per day, and \(k_{\rm out} = 0.02\) per day at the end, 0.3 times \(k_e\). The curve begins fast and ends slow, and that ordering is why its parts separate.
Peletier, Gabrielsson and Haag (references, entry 15) put the same point in dimensionless form: with time scaled by \(1/k_e\) and the count by \(B_0\), the whole curve is fixed by three numbers, \(\kappa = k_{\rm out}/k_e\), \(E_{\max}\), and \(C_{\max}/EC_{50}\). The two rates above are \(\kappa\) and \(\kappa(1 + E_{\max})\) in those units. Krzyzanski and Jusko (entry 17) show the same competition for an infusion: the response approaches its steady state at the slower of \(k_e\) and \(k_{\rm out}(1 + E)\). Sections 2.3 to 2.8 note where each result below is already in these papers. Several of them originate in Krzyzanski and Jusko 1997 (entry 13), the bolus paper the others build on. That paper has not been obtained, so it is cited here as given in Sharma and Jusko 1996.
The model also depends on concentration only through \(C/EC_{50}\), so scaling the dose and \(EC_{50}\) by the same factor leaves the curve unchanged. Sharma and Jusko made the same observation for all four indirect-response models in 1996 (references, entry 12).
2.2 The baseline
\(B(0) = B_0\), and \(B \to B_0\) as the drug clears. The baseline carries \(B_0\) and nothing else.
2.3 The fall
For the first days, \(t \ll 1/k_e = 15\) days, the concentration has barely moved from \(C_{\max}\), so the coefficient in the model equation is constant and the equation is linear:
\[ B(t) = B_{\rm ss} + (B_0 - B_{\rm ss})\, e^{-k_f t}, \qquad k_f = k_{\rm out}\big(1 + E(C_{\max})\big), \qquad B_{\rm ss} = \frac{B_0}{1 + E(C_{\max})} \]
The initial slope of \(\ln B\) is \(-k_{\rm out} E(C_{\max})\), and the time to fall to half of baseline is
\[ t_{1/2,\rm fall} = \frac{1}{k_f} \ln \frac{B_0 - B_{\rm ss}}{B_0/2 - B_{\rm ss}} \approx \frac{\ln 2}{k_{\rm out}(1 + E_{\max})} \quad \text{for } C_{\max} \gg EC_{50},\ E_{\max} \gg 1 \]
The fall carries the product \(k_{\rm out}(1 + E_{\max})\). \(EC_{50}\) enters it only through \(E(C_{\max}) = E_{\max}/(1 + EC_{50}/C_{\max})\), a 1% correction at \(C_{\max} = 100 \times EC_{50}\). With the values here, \(t_{1/2,\rm fall}\) is 0.23 days, five and a half hours, and the fall is 99% complete by day 1.5.
Both pieces are published. Sharma and Jusko 1996 (entry 12, their Eq. 26, taken from Krzyzanski and Jusko 1997) give the large-dose initial slope as \(-k_{\rm out} B_0 S_{\max}\), the slope above in absolute units. Peletier et al. (entry 15, their Eq. 32) prove that for every dose
\[ B(t) > \frac{B_0}{1 + E_{\max}} \left(1 + E_{\max}\, e^{-k_{\rm out}(1 + E_{\max}) t}\right) \]
and that the curve converges to this bound as the dose grows. The bound is the fall formula above with \(E(C_{\max})\) replaced by \(E_{\max}\).
2.4 The floor
After the fall, \(k_f \gg k_e\) and \(B\) tracks the quasi-steady state:
\[ B(t) \approx \frac{B_0}{1 + E\big(C(t)\big)} \approx \frac{B_0}{1 + E_{\max}} \quad \text{while } C(t) \gg EC_{50} \]
The floor carries \(E_{\max}\), given \(B_0\), and is the large-dose limit of the nadir in Sharma and Jusko 1996 (entry 12, their Eq. 14, taken from Krzyzanski and Jusko 1997). With \(E_{\max} = 150\) it is 1.3 cells/µL. A floor is quantifiable only if it sits above the limit \(f B_0\), which needs \(E_{\max} < 1/f - 1\): below 19 for a limit at 5% of baseline, below 39 for one at 2.5%.
2.5 The climb back
The count stays on the quasi-steady state as the drug clears, and crosses the fraction \(f\) of baseline when \(E(C) = (1 - f)/f\). Solving the \(E_{\max}\) function for that concentration,
\[ C_f = EC_{50}\, \frac{1 - f}{f E_{\max} - (1 - f)} \]
and with \(C(t) = C_{\max} e^{-k_e t}\) the crossing time is
\[ t_f = \frac{1}{k_e} \ln \frac{C_{\max}}{C_f} = \underbrace{\frac{1}{k_e} \ln \frac{f\, S_0\, C_{\max}}{1 - f}}_{\text{depends on } S_0 \text{ only}} + \underbrace{\frac{1}{k_e} \ln\left(1 - \frac{1 - f}{f E_{\max}}\right)}_{\text{the only place } E_{\max} \text{ enters alone}} \]
The climb back carries \(S_0 = E_{\max}/EC_{50}\), given \(k_e\) from the PK. The second term is the only information about \(E_{\max}\) separately that survives in the recovery. With \(f = 0.05\) it is \(-2.0\) days at \(E_{\max} = 150\), \(-7.2\) days at 50 and \(-0.6\) days at 450: a shift of a few days in a crossing that happens around day 100, read through 30% residual error from monthly samples. This term is why the designs of Section 6 with a first sample at day 7 leave \(E_{\max}\) at 90% to over 800% relative standard error rather than at infinity.
Two conditions hold the formula together. The count must still be on the quasi-steady state at the crossing, which needs \(k_{\rm out}/f \gg k_e\), or \(f \ll k_{\rm out}/k_e = 0.3\); when it fails the count lags and the crossing comes a few days later than the formula says. And the crossing concentration must be below \(EC_{50}\), which holds whenever \(f E_{\max} \gg 1\).
Across a dose escalation, \(\partial t_f / \partial \ln C_{\max} = 1/k_e\), so each ten-fold step in dose delays the climb by \(\ln 10 / k_e = 34.5\) days, 3.3 PK half-lives, whatever \(E_{\max}\) and \(EC_{50}\) are. This is the dose-duration relation usually attributed to Levy in 1966 (references, entry 11; the paper has not been obtained, and the attribution rests on secondary sources): the duration of an effect is linear in log dose, the slope gives the elimination rate, and the line extrapolates to zero duration at a threshold dose, here \(C_{\max} = (1 - f)/(f S_0)\). As those sources describe it, Levy’s relation is for a direct effect with a threshold. The indirect-response model gives the same line because the count follows the quasi-steady state, which is a direct function of concentration. Panel C of the figure shows the line and the points falling on it, with the lowest doses bending away where the count never reaches the quasi-steady state.
Peletier et al. (entry 15, their Eqs. 42 to 44) prove the general form of this. As the dose grows, the recovery part of the curve converges to a fixed shape that translates in time by \(\ln(C_{\max}/EC_{50})/k_e\), a travelling wave. The crossing time \(t_f\) is where that shape crosses \(f\), worked out under the quasi-steady state; the shape itself depends on \(E_{\max}\) and \(\kappa\), which is where the correction term above comes from.
2.6 The tail
Once \(S_0 C \ll 1\), the drug effect is negligible and the model is \(dB/dt = k_{\rm out}(B_0 - B)\), so
\[ B_0 - B(t) \propto e^{-k_{\rm out} t} \]
The tail carries \(k_{\rm out}\). This needs \(k_{\rm out} < k_e\). If the cells turned over faster than the drug cleared, the count would follow the drug down to baseline and the tail would carry \(k_e\) instead, the indirect-response version of flip-flop kinetics. Here \(k_{\rm out}/k_e = 0.3\).
2.7 Doses that stay below EC50
When \(C_{\max} \ll EC_{50}\) the drug effect is in its linear range for the whole curve,
\[ E(C) = \frac{S_0 C}{1 + C/EC_{50}} = S_0 C \left(1 - \frac{C}{EC_{50}} + \dots\right) \approx S_0 C \]
and the model becomes \(dB/dt = k_{\rm out} B_0 - k_{\rm out}(1 + S_0 C) B\), which contains \(E_{\max}\) and \(EC_{50}\) only as their ratio. The whole curve of a low dose, nadir included, carries \(S_0\) and \(k_{\rm out}\), with a correction of relative size \(C_{\max}/EC_{50}\). When the depletion is also shallow, \(S_0 C_{\max} \ll 1\), the depth \(\varepsilon = 1 - B/B_0\) obeys \(d\varepsilon/dt \approx k_{\rm out}(S_0 C - \varepsilon)\), which has the same solution as an oral one-compartment PK model:
\[ \varepsilon(t) = \frac{k_{\rm out}\, S_0 C_{\max}}{k_e - k_{\rm out}} \left(e^{-k_{\rm out} t} - e^{-k_e t}\right), \qquad \varepsilon_{\max} = S_0 C_{\max} \left(\frac{k_{\rm out}}{k_e}\right)^{k_e/(k_e - k_{\rm out})} \]
at \(t = \ln(k_e/k_{\rm out})/(k_e - k_{\rm out})\), day 26 here. The nadir depth is proportional to \(S_0 C_{\max}\), with a factor of 0.18 set by the two rates. The same solution and nadir time are Eqs. 34 and 35 of Peletier et al. (entry 15), for the linear drug effect.
2.8 The area between baseline and curve
The area between the baseline and the B-cell curve, \(\int_0^\infty (B_0 - B)\,dt\), is the summary Sharma and Jusko (entry 12, their Eq. 22) and Peletier et al. (entry 15, their Eq. 49) give for large doses:
\[ \text{area} \sim \frac{B_0}{k_e} \frac{E_{\max}}{1 + E_{\max}} \ln\left(1 + \frac{C_{\max}}{EC_{50}}\right) \quad \text{as } C_{\max} \to \infty \]
Peletier et al. note that \(E_{\max}\) can be read from the slope of the area against log dose. For a B-cell depleting agent the slope carries almost no \(E_{\max}\): the factor \(E_{\max}/(1 + E_{\max})\) is 0.98 at \(E_{\max} = 50\) and 0.993 at 150. The formula is also a leading-order statement, and at practical doses the omitted constant is larger than the term kept. The table compares it with the area measured on the ODE solution for the three parameter sets of panel C that share \(S_0 = 150\).
area_ode <- function(dose, Emax, EC50) {
  tt <- seq(0, 3000, by = 0.5); sum(B0 - sim_B(dose, Emax, EC50, kout, B0, times = tt)) * 0.5
}
area <- expand.grid(k = 1:3, cmax = c(1, 10, 100, 1000)) %>%
  mutate(Emax = sets$Emax[k], EC50 = sets$EC50[k],
         ode = mapply(function(c, e, ec) area_ode(c * V, e, ec), cmax, Emax, EC50),
         formula = B0 / ke * Emax / (1 + Emax) * log(1 + cmax / EC50)) %>%
  select(cmax, Emax, EC50, ode, formula)
knitr::kable(area, digits = c(0, 0, 2, 0, 0),
  col.names = c("Cmax, mg/L", "Emax", "EC50, mg/L", "Area on the ODE, cells·day/µL", "Large-dose formula"),
caption = "Area between baseline and B-cell curve, from the ODE solution and from the large-dose formula, for three parameter sets with Emax/EC50 = 150")| Cmax, mg/L | Emax | EC50, mg/L | Area on the ODE, cells·day/µL | Large-dose formula |
|---|---|---|---|---|
| 1 | 50 | 0.33 | 21407 | 4077 |
| 1 | 150 | 1.00 | 21715 | 2066 |
| 1 | 450 | 3.00 | 21818 | 861 |
| 10 | 50 | 0.33 | 28222 | 10100 |
| 10 | 150 | 1.00 | 28615 | 7146 |
| 10 | 450 | 3.00 | 28738 | 4389 |
| 100 | 50 | 0.33 | 34999 | 16786 |
| 100 | 150 | 1.00 | 35481 | 13754 |
| 100 | 450 | 3.00 | 35631 | 10585 |
| 1000 | 50 | 0.33 | 41771 | 23549 |
| 1000 | 150 | 1.00 | 42343 | 20589 |
| 1000 | 450 | 3.00 | 42523 | 17398 |
The measured area moves by \(B_0 \ln 10 / k_e\) per ten-fold dose, as the formula’s slope says, and at a given dose it is nearly the same for all three sets: like the climb back, it follows \(S_0\). The formula’s level is low by a factor that shrinks only logarithmically with dose. The omitted constant is of order \((B_0/k_e)\ln E_{\max} + B_0/k_{\rm out}\), the extra time for the drug to fall from \(EC_{50}\) to \(EC_{50}/E_{\max}\) plus the lag of the recovery, and with \(E_{\max} = 150\) and slow turnover both are large. The area is computed over the whole curve, including the part below the limit, so it is not an observable a B-cell study can use directly in any case.
2.9 Checking the formulas against the ODE solution
Each formula above is an approximation, and each can be checked by solving the model and measuring the feature it predicts. Forty parameter sets drawn at random, log-uniformly, with \(E_{\max}\) from 30 to 1000, \(EC_{50}\) from 0.1 to 10 mg/L, \(k_{\rm out}\) from 0.005 to 0.04 per day, and the dose putting \(C_{\max}\) between 30 and 1000 times \(EC_{50}\), or for the low-dose check between 0.003 and 0.1 times \(1/S_0\). The PK is held at Section 1’s values.
set.seed(2)
n_chk <- 40
ps <- data.frame(Emax = exp(runif(n_chk, log(30), log(1000))), EC50 = exp(runif(n_chk, log(0.1), log(10))),
                 kout = exp(runif(n_chk, log(0.005), log(0.04))), r = exp(runif(n_chk, log(30), log(1000))),
                 r_low = exp(runif(n_chk, log(0.003), log(0.1))))
chk <- bind_rows(lapply(seq_len(n_chk), function(i) with(ps[i, ], {
  s0 <- Emax / EC50; cmax <- r * EC50
  tf <- seq(0, 10, by = 0.002); Bf <- sim_B(cmax * V, Emax, EC50, kout, B0, times = tf)
  tt <- seq(0, 1500, by = 0.25); B <- sim_B(cmax * V, Emax, EC50, kout, B0, times = tt)
  i0 <- which.min(B)
  t1 <- log(s0 * cmax / 1e-3) / ke; w <- tt >= t1 & tt <= t1 + 60
  c_low <- r_low / s0; B_low <- sim_B(c_low * V, Emax, EC50, kout, B0, times = seq(0, 600, by = 0.25))
  data.frame(feature = c("Fall, days", "Floor, cells/µL", "Climb back, day", "Tail rate, per day", "Low-dose nadir depth"),
    ode = c(tf[which(Bf <= B0 / 2)[1]], min(B), tt[i0 - 1 + which(B[i0:length(B)] >= f_loq * B0)[1]],
            -unname(coef(lm(log(B0 - B[w]) ~ tt[w]))[2]), 1 - min(B_low) / B0),
    formula = c(log(2) / (kout * (1 + Emax)), B0 / (1 + Emax), log(f_loq * s0 * cmax / (1 - f_loq)) / ke,
                kout, s0 * c_low * (kout / ke)^(ke / (ke - kout))))
})))
chk$feature <- factor(chk$feature, levels = unique(chk$feature))
ggplot(chk, aes(formula, ode)) +
  geom_abline(colour = "grey60") +
  geom_point(colour = pal3[1], size = 1.8) +
  scale_x_log10() + scale_y_log10() +
  facet_wrap(~ feature, scales = "free", nrow = 2) +
  labs(x = "Formula", y = "Measured on the ODE solution")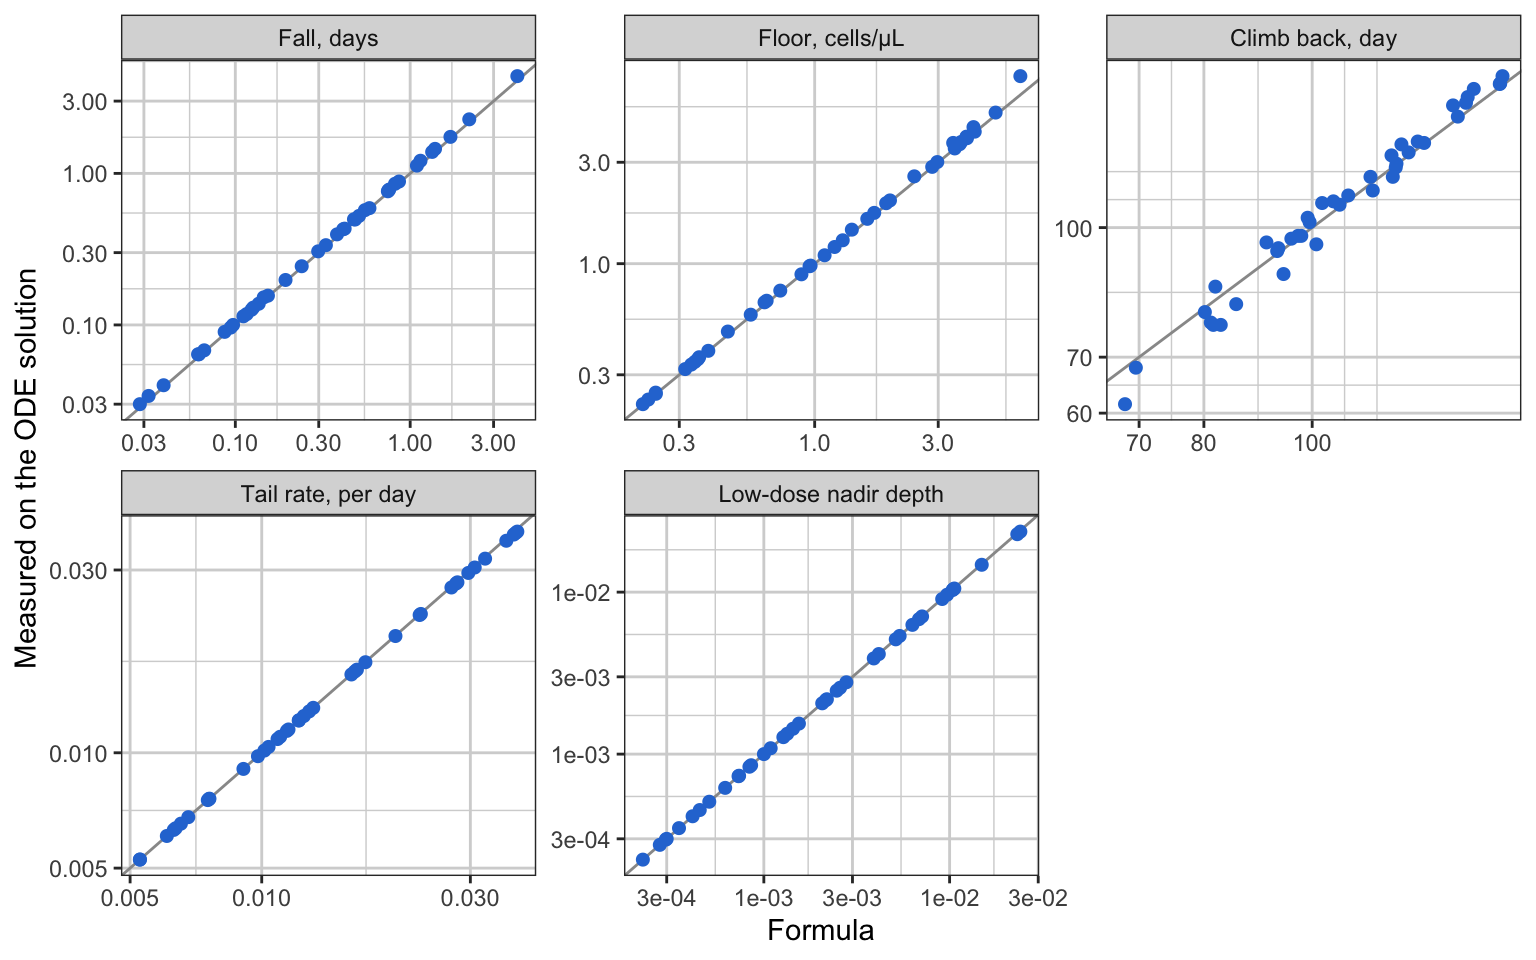
chk %>% group_by(feature) %>%
  summarise(median_err = median(100 * abs(ode / formula - 1)), max_err = max(100 * abs(ode / formula - 1)),
            max_days = if (grepl("day", first(feature))) max(abs(ode - formula)) else NA) %>%
  knitr::kable(digits = 1, col.names = c("Feature", "Median error, %", "Largest error, %", "Largest error, days"),
caption = "Agreement between the formulas and the ODE solution over the forty parameter sets")| Feature | Median error, % | Largest error, % | Largest error, days |
|---|---|---|---|
| Fall, days | 2.8 | 6.9 | 0.3 |
| Floor, cells/µL | 1.5 | 22.5 | NA |
| Climb back, day | 2.4 | 9.6 | 7.0 |
| Tail rate, per day | 0.1 | 1.6 | 0.0 |
| Low-dose nadir depth | 0.1 | 1.6 | NA |
The fall and floor formulas err most where \(C_{\max}\) is only 30 times \(EC_{50}\) or \(k_{\rm out}\) is small, because the concentration has moved before the fall is over and the floor is then \(B_0/(1 + E(C))\) at a \(C\) below \(C_{\max}\). The climb-back formula errs by days where \(k_{\rm out}/f\) is not much larger than \(k_e\), the lag of Section 2.5. The tail and low-dose formulas are close to exact.
2.10 What is identifiable and what is not
Structurally, the model is identifiable: with noise-free observations at every time, the floor gives \(E_{\max}\) and the fall gives it again, and \(EC_{50} = E_{\max}/S_0\) follows. Janzén et al. (references, entry 16) checked a family of turnover and receptor-binding models formally and found the same, with the same failure in practice: when the effect saturates, the two parameters of the saturating function are estimated with high uncertainty and correlation, and the ratio is estimated well. The loss of identifiability here is practical, made by the quantification limit and the sampling schedule, and the parts of Section 2.2 to 2.7 say exactly which samples remove which parameter.
The identification chain itself is in Sharma and Jusko 1998 (entry 4, their Table 1), as a graphical recipe: read the baseline, the initial slope and the large-dose nadir; the nadir gives \(S_{\max}\), the slope with \(S_{\max}\) gives \(k_{\rm in}\) and so \(k_{\rm out}\), and the concentration at the time of the nadir gives \(SC_{50}\). The design they say it needs is two or more bolus doses, one high enough for full stimulation, and the baseline. For B cells the first two readings are the ones a study loses: the nadir sits below the limit, and the initial slope is over before a weekly sample.
| Part of the curve | Carries | Observed when | Usual B-cell study |
|---|---|---|---|
| Baseline | \(B_0\) | always | ✅ |
| Fall | \(k_{\rm out}(1 + E_{\max})\) | samples in the first one to two days, above the limit | ❌ first sample at a week |
| Floor | \(E_{\max}\) | \(E_{\max} < 1/f - 1\) | ❌ below the limit |
| Climb back | \(S_0\); \(E_{\max}\) only through a few-day correction | samples through recovery; \(k_e\) from PK | ✅ |
| Tail | \(k_{\rm out}\) | samples until repopulation | ✅ |
| Low-dose cohort | \(S_0\), \(k_{\rm out}\) | any dose with \(C_{\max} \ll EC_{50}\) | ✅ when present, and adds no \(E_{\max}\) |
- ✅ Identified by any design that follows the recovery to the end: \(B_0\), \(k_{\rm out}\), and \(S_0 = E_{\max}/EC_{50}\).
- ⚠️ \(E_{\max}\): only from samples during the fall, or from a floor above the limit. Without either, it is left with the climb-back correction of Section 2.5, a few days on a hundred-day timing.
- ❌ \(EC_{50}\) on its own: from no part of the curve. It is identified exactly when \(E_{\max}\) is, as \(E_{\max}/S_0\), and with the same precision or worse.
The figure below makes the table concrete. Three parameter sets share \(S_0 = 150\) and differ three-fold in \(E_{\max}\) and \(EC_{50}\). Above the limit, their curves separate in the first two days and nowhere else.
same <- bind_rows(lapply(1:3, function(k) bind_rows(
  data.frame(set = sets$set[k], panel = panels[1], day = d_short,
             B = sim_B(300, sets$Emax[k], sets$EC50[k], kout, B0, times = d_short)),
  data.frame(set = sets$set[k], panel = panels[2], day = d_long,
             B = sim_B(300, sets$Emax[k], sets$EC50[k], kout, B0, times = d_long)))))
same$panel <- factor(same$panel, levels = panels); same$set <- factor(same$set, levels = sets$set[1:3])
ggplot(same, aes(day, B, colour = set)) +
  geom_hline(yintercept = f_loq * B0, linetype = 2, colour = "grey50") +
  geom_line(linewidth = 0.8) +
  scale_colour_manual(values = pal3, name = NULL) +
  scale_y_log10(breaks = c(1, 10, 100), limits = c(0.3, 300)) +
  facet_wrap(~ panel, scales = "free_x") +
  labs(x = "Day", y = "B cells per µL, log scale") +
  theme(legend.position = "bottom")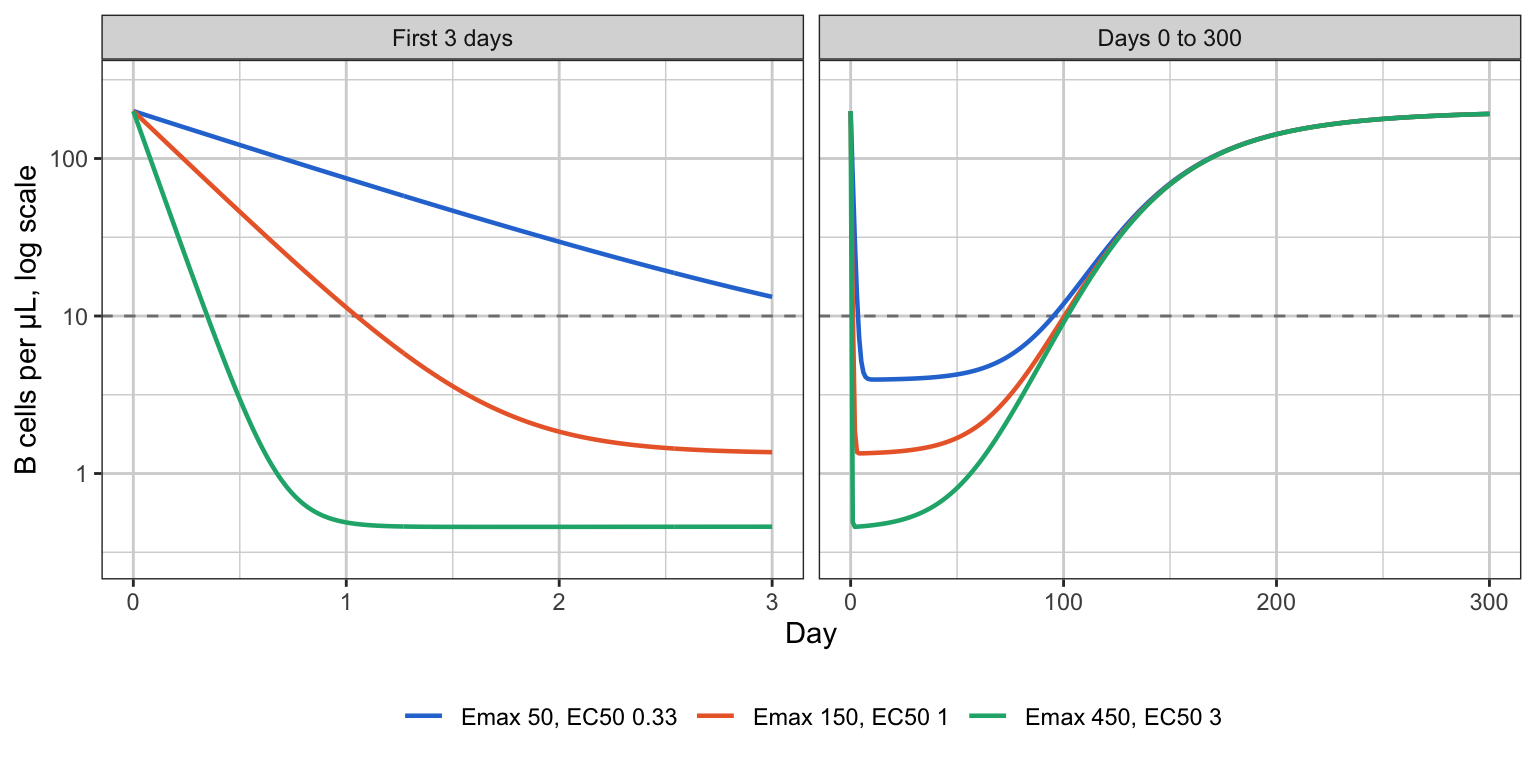
3. What the data look like
Five single doses a ten-fold apart, the highest giving a peak concentration of 100 × \(EC_{50}\) and the lowest 0.01 × \(EC_{50}\). The horizontal line is a flow-cytometry limit of 10 cells/µL.
tt <- seq(0, 336, by = 2)
doses <- c(0.03, 0.3, 3, 30, 300)
prof <- bind_rows(lapply(doses, function(d)
  data.frame(dose = d, cmax = d / V, day = tt, B = sim_B(d, Emax, EC50, kout, B0, times = tt))))
prof$label <- factor(sprintf("%g", prof$cmax), levels = sprintf("%g", doses / V))
ggplot(prof, aes(day, B, colour = label)) +
  geom_hline(yintercept = 10, linetype = 2, colour = "grey50") +
  geom_line(linewidth = 0.8) +
  scale_colour_manual(values = ramp5, name = "Cmax, multiples of EC50") +
  scale_y_log10(breaks = c(1, 10, 100), limits = c(0.5, 300)) +
  annotate("text", x = 330, y = 10, label = "LOQ", hjust = 1, vjust = -0.4, size = 3, colour = "grey40") +
  labs(x = "Day", y = "B cells per µL, log scale") +
  theme(legend.position = "bottom")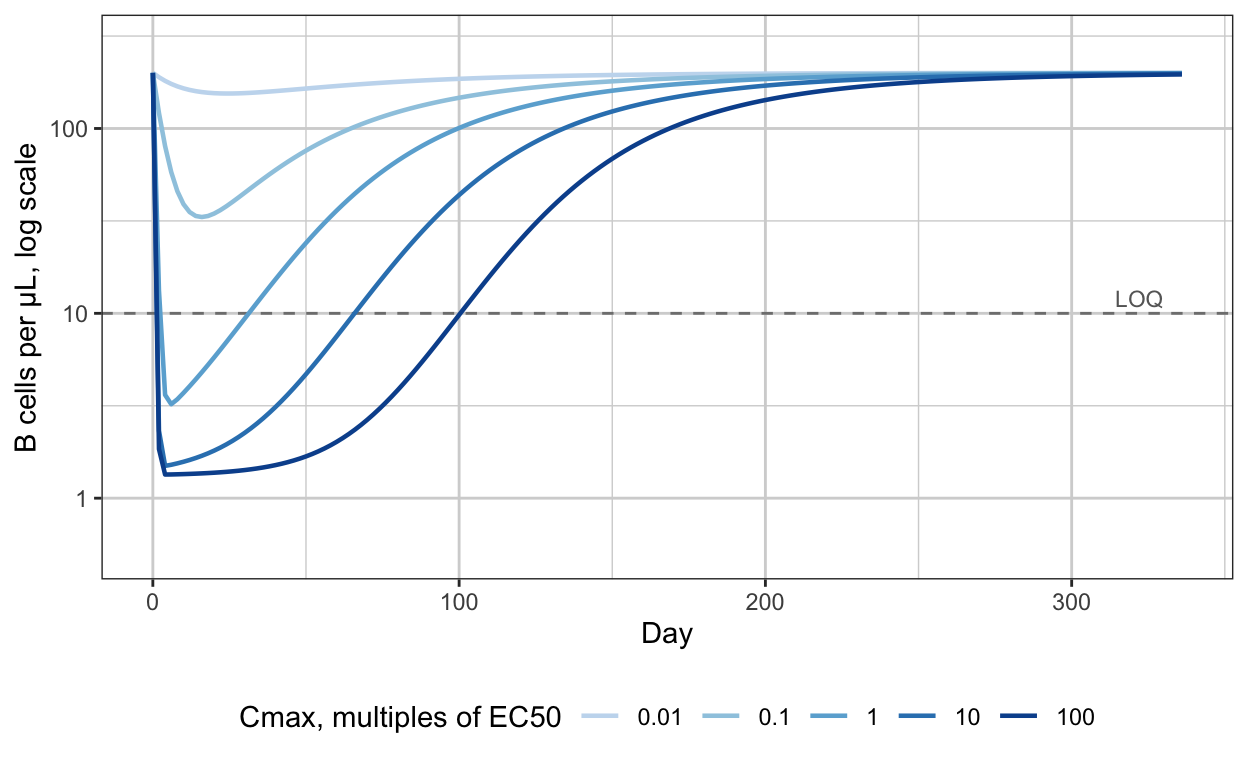
Two things to read off. Between \(C_{\max} = 1 \times EC_{50}\) and \(100 \times EC_{50}\) the curves are indistinguishable for the first two months: same fall, same floor, all below the limit. What differs is when recovery starts, and it starts later by \(\ln 10/k_e = 34.5\) days, 3.3 PK half-lives, for each ten-fold increase in dose (Section 2.5). And the only curve that stays quantifiable throughout is the lowest, at \(C_{\max} = 0.01 \times EC_{50}\), where the drug effect is in its linear range and says nothing about \(EC_{50}\) on its own.
4. The arithmetic of a large Emax
At a steady concentration \(C\), the count settles at
\[ \frac{B_{ss}}{B_0} = \frac{1}{1 + E(C)} = \frac{1}{1 + E_{\max} C/(EC_{50} + C)} \]
so that half-maximal depletion, \(B_{ss} = B_0/2\), needs \(E = 1\), which is at
\[ C_{1/2} = \frac{EC_{50}}{E_{\max} - 1} \]
For \(E_{\max} = 150\) that is \(EC_{50}/149\). The concentration that halves the drug’s effect on the rate and the concentration that halves the cell count are two orders of magnitude apart.
cc <- 10^seq(-4, 2, length.out = 300)
dep <- bind_rows(lapply(c(1, 10, 150), function(em)
  data.frame(Emax = em, C = cc, frac = 1 / (1 + em * cc / (1 + cc)))))
dep$Emax <- factor(paste("Emax =", dep$Emax), levels = paste("Emax =", c(1, 10, 150)))
ggplot(dep, aes(C, 100 * frac, colour = Emax)) +
  geom_vline(xintercept = 1, linetype = 2, colour = "grey50") +
  geom_hline(yintercept = 5, linetype = 3, colour = "grey50") +
  geom_line(linewidth = 0.8) +
  scale_colour_manual(values = pal3, name = NULL) +
  scale_x_log10(breaks = 10^(-4:2), labels = c("0.0001", "0.001", "0.01", "0.1", "1", "10", "100")) +
  annotate("text", x = 1, y = 95, label = "EC50", hjust = -0.1, size = 3, colour = "grey40") +
  annotate("text", x = 1e-4, y = 5, label = "5% LOQ", hjust = 0, vjust = -0.4, size = 3, colour = "grey40") +
  labs(x = "Concentration, multiples of EC50, log scale", y = "Steady-state B cells, % of baseline") +
  theme(legend.position = "bottom")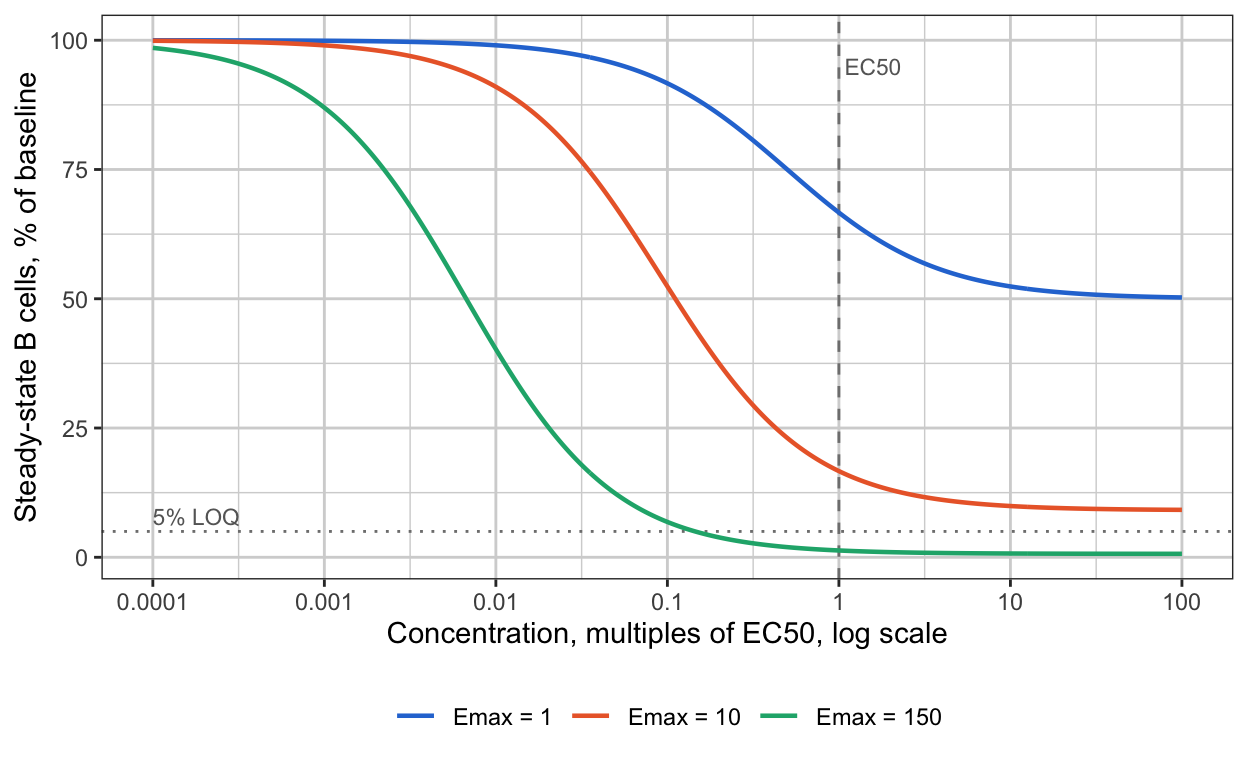
The consequence is a band. Below \(C_{1/2}/10\) the effect is small and linear in \(C\) with slope \(E_{\max}/EC_{50}\). Above \(EC_{50}\) the count is below the limit whatever \(C\) is. In between, the count is quantifiable and its level depends on \(E_{\max}\) and \(EC_{50}\) separately. That band, roughly \(EC_{50}/1500\) to \(EC_{50}/15\) here, is where a cohort would have to sit for the nadir to identify the two parameters, and no therapeutic dose sits there. Krzyzanski and Jusko made the same point for infusions in 1998 (references, entry 17): two steady states give \(E_{\max}\) and \(EC_{50}\) only if their concentrations are not both well above \(EC_{50}\).
5. Where the information lives
The sensitivity of the log count to each log parameter, along the top-dose profile, says what each observation can tell the estimator.
tt <- seq(0, 336, by = 1); h <- 1e-4
f0 <- sim_B(300, Emax, EC50, kout, B0, times = tt)
sens <- data.frame(day = tt,
  Emax = (log(sim_B(300, Emax * exp(h), EC50, kout, B0, times = tt)) - log(f0)) / h,
  EC50 = (log(sim_B(300, Emax, EC50 * exp(h), kout, B0, times = tt)) - log(f0)) / h,
  kout = (log(sim_B(300, Emax, EC50, kout * exp(h), B0, times = tt)) - log(f0)) / h,
  B = f0)
blq <- range(sens$day[sens$B < 0.05 * B0])
sl <- pivot_longer(sens, c(Emax, EC50, kout), names_to = "parameter", values_to = "s")
sl$parameter <- factor(sl$parameter, levels = c("Emax", "EC50", "kout"))
ggplot(sl, aes(day, s, colour = parameter)) +
  annotate("rect", xmin = blq[1], xmax = blq[2], ymin = -Inf, ymax = Inf, alpha = 0.08, fill = "grey30") +
  geom_hline(yintercept = 0, colour = "grey60") +
  geom_line(linewidth = 0.8) +
  scale_colour_manual(values = pal3, name = NULL) +
  labs(x = "Day", y = "d log B / d log parameter") +
  theme(legend.position = "bottom")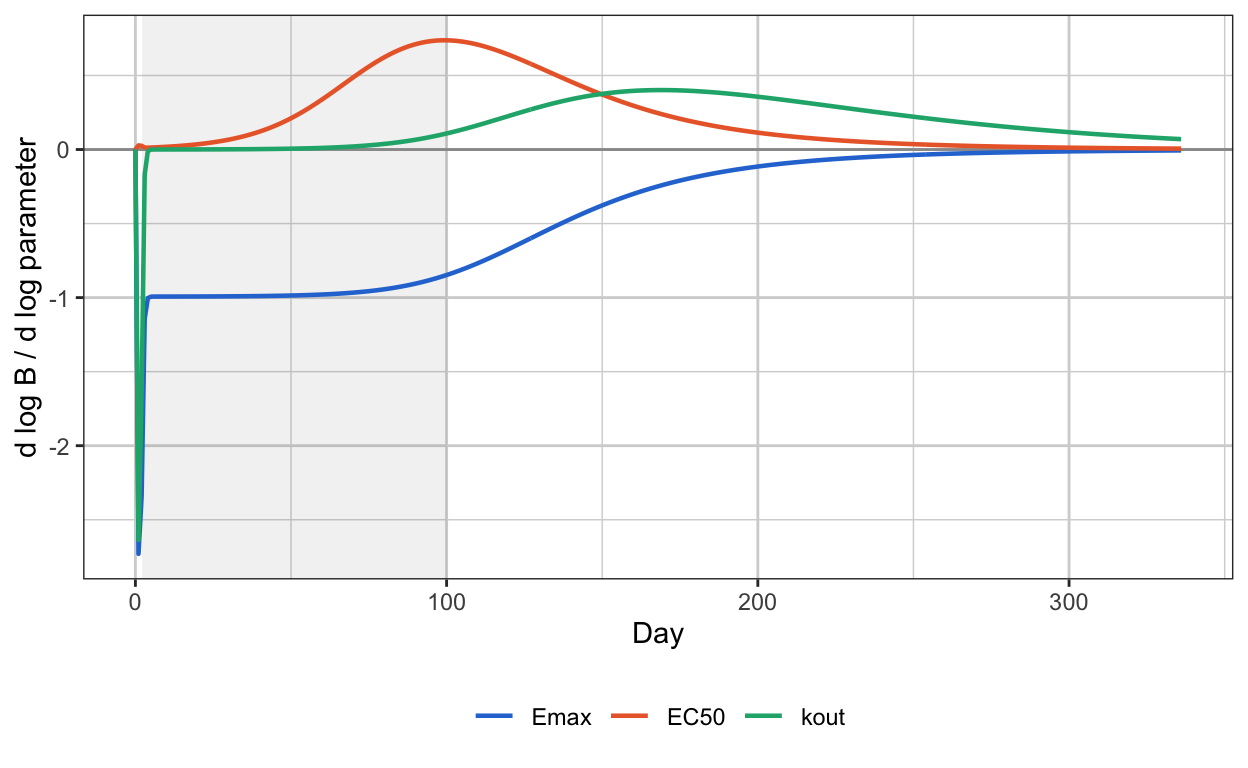
Three regions, and each one identifies one thing.
Days 0 to 3, the fall. Sensitivity to \(E_{\max}\) and to \(k_{\rm out}\) are both large and equal, and sensitivity to \(EC_{50}\) is near zero. At high concentration the loss rate is \(k_{\rm out}(1 + E_{\max})\), so the speed of the fall identifies the product \(k_{\rm out} E_{\max}\) and nothing about \(EC_{50}\). This is the only place \(E_{\max}\) appears without \(EC_{50}\) beside it.
Days 4 to 80, the floor. Everything is below the limit. No observations, no information.
Days 80 to 200, the recovery. Sensitivity to \(E_{\max}\) and \(EC_{50}\) are equal and opposite: raising one or lowering the other shifts the curve the same way. Recovery begins when \(E(C)\) falls to order 1, which happens at \(C \approx EC_{50}/E_{\max}\), so this region identifies the ratio and only the ratio. Sensitivity to \(k_{\rm out}\) rises through the recovery and is the last thing standing at day 250, so the tail identifies \(k_{\rm out}\) alone.
The chain in the In brief diagram follows. \(k_{\rm out}\) from the tail; \(k_{\rm out} E_{\max}\) from the fall, hence \(E_{\max}\); \(E_{\max}/EC_{50}\) from the recovery’s timing, hence \(EC_{50}\). Remove the fall from the data and the chain breaks at its second link.
6. Expected precision by design
The Fisher information for the four log-parameters, from the sensitivities at each sampling time, summed over patients and dose levels, with observations below the limit dropped. Dropping them understates the information slightly, since a censored value still says the count is below the limit, and the comparison between designs is unaffected. Four dose designs, two limits, and two sampling schedules that differ only in whether days 1 and 3 are sampled.
t_dense  <- c(0, 1, 3, 7, 14, 28, 56, 84, 112, 140, 168, 224, 280, 336)
t_sparse <- c(0, 7, 14, 28, 56, 84, 112, 140, 168, 224, 280, 336)
fim_design <- function(doses_n, loq, sigma = 0.3, times) {
  th <- log(c(Emax, EC50, kout, B0)); J <- NULL
  for (k in seq_along(doses_n$dose)) {
    d <- doses_n$dose[k]; n <- doses_n$n[k]
    f0 <- sim_B(d, Emax, EC50, kout, B0, times = times); keep <- f0 >= loq
    Jd <- sapply(1:4, function(j) { h <- 1e-4; th2 <- th; th2[j] <- th2[j] + h; p <- exp(th2)
      (log(sim_B(d, p[1], p[2], p[3], p[4], times = times)) - log(f0)) / h })
    J <- rbind(J, sqrt(n) * Jd[keep, , drop = FALSE])
  }
  Fi <- t(J) %*% J / sigma^2
  Vm <- tryCatch(solve(Fi), error = function(e) matrix(NA, 4, 4))
  se <- sqrt(diag(Vm))
  data.frame(rse_Emax = 100 * se[1], rse_EC50 = 100 * se[2],
             corr = Vm[1, 2] / sqrt(Vm[1, 1] * Vm[2, 2]),
             rse_slope = 100 * sqrt(Vm[1, 1] + Vm[2, 2] - 2 * Vm[1, 2]),
             rse_kout = 100 * se[3], n_obs = nrow(J))
}
designs <- list(
  "A: 300 mg only, 6 patients"                 = data.frame(dose = 300, n = 6),
  "B: 30, 100, 300 mg; 4 each"                 = data.frame(dose = c(30, 100, 300), n = 4),
  "C: 3 to 300 mg, five levels; 4 each"        = data.frame(dose = c(3, 10, 30, 100, 300), n = 4),
  "D: C with 0.03 and 0.3 mg replacing 10, 100" = data.frame(dose = c(0.03, 0.3, 3, 30, 300), n = 4))
grid <- expand.grid(design = names(designs), loq = c(5, 10), sampling = c("first sample day 1", "first sample day 7"),
                    stringsAsFactors = FALSE)
res <- bind_rows(lapply(seq_len(nrow(grid)), function(i) {
  tt <- if (grid$sampling[i] == "first sample day 1") t_dense else t_sparse
  cbind(grid[i, ], fim_design(designs[[grid$design[i]]], loq = grid$loq[i], times = tt))
}))
res %>% filter(loq == 5) %>% select(sampling, design, rse_Emax, rse_EC50, corr, rse_slope, rse_kout, n_obs) %>%
  arrange(sampling, design) %>%
  knitr::kable(digits = c(0, 0, 0, 0, 2, 0, 0, 0),
    col.names = c("Sampling", "Design", "RSE Emax %", "RSE EC50 %", "corr(Emax, EC50)", "RSE Emax/EC50 %", "RSE k_out %", "Observations kept"),
caption = "Expected precision from the Fisher information, LOQ 5 cells/µL (2.5% of baseline), 30% proportional error")| Sampling | Design | RSE Emax % | RSE EC50 % | corr(Emax, EC50) | RSE Emax/EC50 % | RSE k_out % | Observations kept |
|---|---|---|---|---|---|---|---|
| first sample day 1 | A: 300 mg only, 6 patients | 41 | 55 | 0.94 | 21 | 39 | 8 |
| first sample day 1 | B: 30, 100, 300 mg; 4 each | 26 | 34 | 0.94 | 13 | 24 | 27 |
| first sample day 1 | C: 3 to 300 mg, five levels; 4 each | 12 | 13 | 0.83 | 7 | 10 | 49 |
| first sample day 1 | D: C with 0.03 and 0.3 mg replacing 10, 100 | 10 | 9 | 0.72 | 7 | 8 | 58 |
| first sample day 7 | A: 300 mg only, 6 patients | 833 | 894 | 1.00 | 65 | 56 | 7 |
| first sample day 7 | B: 30, 100, 300 mg; 4 each | 127 | 144 | 1.00 | 21 | 28 | 24 |
| first sample day 7 | C: 3 to 300 mg, five levels; 4 each | 109 | 123 | 1.00 | 17 | 20 | 43 |
| first sample day 7 | D: C with 0.03 and 0.3 mg replacing 10, 100 | 90 | 98 | 1.00 | 11 | 9 | 50 |
Read down the right-hand columns first. The slope \(E_{\max}/EC_{50}\) and \(k_{\rm out}\) are estimated in every design, at a precision that improves with cohorts and does not depend much on the early samples. Then read \(E_{\max}\) and \(EC_{50}\) against the sampling column. With days 1 and 3 sampled they are estimable, at 40 to 55% RSE from six patients at one dose and around 10% from five cohorts. With the first sample at day 7 they are not estimable in any design: the correlation is 1.00 and the RSEs run from about 90% to over 800%. Design D, which puts two cohorts at concentrations where the nadir is quantifiable, does not rescue them, because those cohorts sit in the linear range below the band of Section 4 and inform the slope, not its factors.
res %>% filter(sampling == "first sample day 1") %>% select(loq, design, rse_Emax, rse_EC50, corr) %>%
  pivot_wider(names_from = loq, values_from = c(rse_Emax, rse_EC50, corr), names_glue = "{.value}, LOQ {loq}") %>%
  knitr::kable(digits = c(0, 0, 0, 0, 0, 2, 2),
caption = "The same, with days 1 and 3 sampled, at two quantification limits: the early samples do more than the limit")| design | rse_Emax, LOQ 5 | rse_Emax, LOQ 10 | rse_EC50, LOQ 5 | rse_EC50, LOQ 10 | corr, LOQ 5 | corr, LOQ 10 |
|---|---|---|---|---|---|---|
| A: 300 mg only, 6 patients | 41 | 41 | 55 | 55 | 0.94 | 0.94 |
| B: 30, 100, 300 mg; 4 each | 26 | 26 | 34 | 35 | 0.94 | 0.93 |
| C: 3 to 300 mg, five levels; 4 each | 12 | 13 | 13 | 17 | 0.83 | 0.84 |
| D: C with 0.03 and 0.3 mg replacing 10, 100 | 10 | 10 | 9 | 10 | 0.72 | 0.66 |
7. The likelihood ridge
The Fisher information is a local statement. The shape of the objective function over \((E_{\max}, EC_{50})\) with \(k_{\rm out}\) and \(B_0\) held at truth shows the same thing globally. Design A, one simulated dataset per panel, sparse sampling on the left and dense on the right.
sse_grid <- function(times, loq = 5, n = 6, seed = 7) {
  set.seed(seed)
  obs <- do.call(rbind, lapply(1:n, function(i) {
    f0 <- sim_B(300, Emax, EC50, kout, B0, times = times)
    y <- f0 * exp(rnorm(length(f0), 0, 0.3)); data.frame(t = times, y = y)[y >= loq & f0 >= loq, ]
  }))
  em <- 10^seq(0.5, 3.5, length.out = 41); ec <- 10^seq(-2, 2, length.out = 41)
  g <- expand.grid(Emax = em, EC50 = ec)
  g$sse <- sapply(seq_len(nrow(g)), function(i) {
    pred <- sim_B(300, g$Emax[i], g$EC50[i], kout, B0, times = times)
    sum((log(obs$y) - log(pred[match(obs$t, times)]))^2)
  })
  g
}
g1 <- sse_grid(t_sparse); g1$panel <- "First sample day 7"
g2 <- sse_grid(t_dense);  g2$panel <- "Days 1 and 3 sampled"
gg <- bind_rows(g1, g2) %>% group_by(panel) %>% mutate(d = sse - min(sse)) %>% ungroup()
gg$panel <- factor(gg$panel, levels = c("First sample day 7", "Days 1 and 3 sampled"))
ggplot(gg, aes(EC50, Emax)) +
  geom_raster(aes(fill = pmin(d, 40))) +
  geom_contour(aes(z = d), breaks = c(2, 6, 12), colour = "white", linewidth = 0.4) +
  annotate("point", x = EC50, y = Emax, shape = 4, size = 3, colour = "black") +
  scale_fill_gradient(low = "#08519c", high = "#f0f4fa", name = "SSE above\nminimum") +
  scale_x_log10() + scale_y_log10() +
  facet_wrap(~ panel) +
  labs(x = "EC50, mg/L, log scale", y = "Emax, log scale")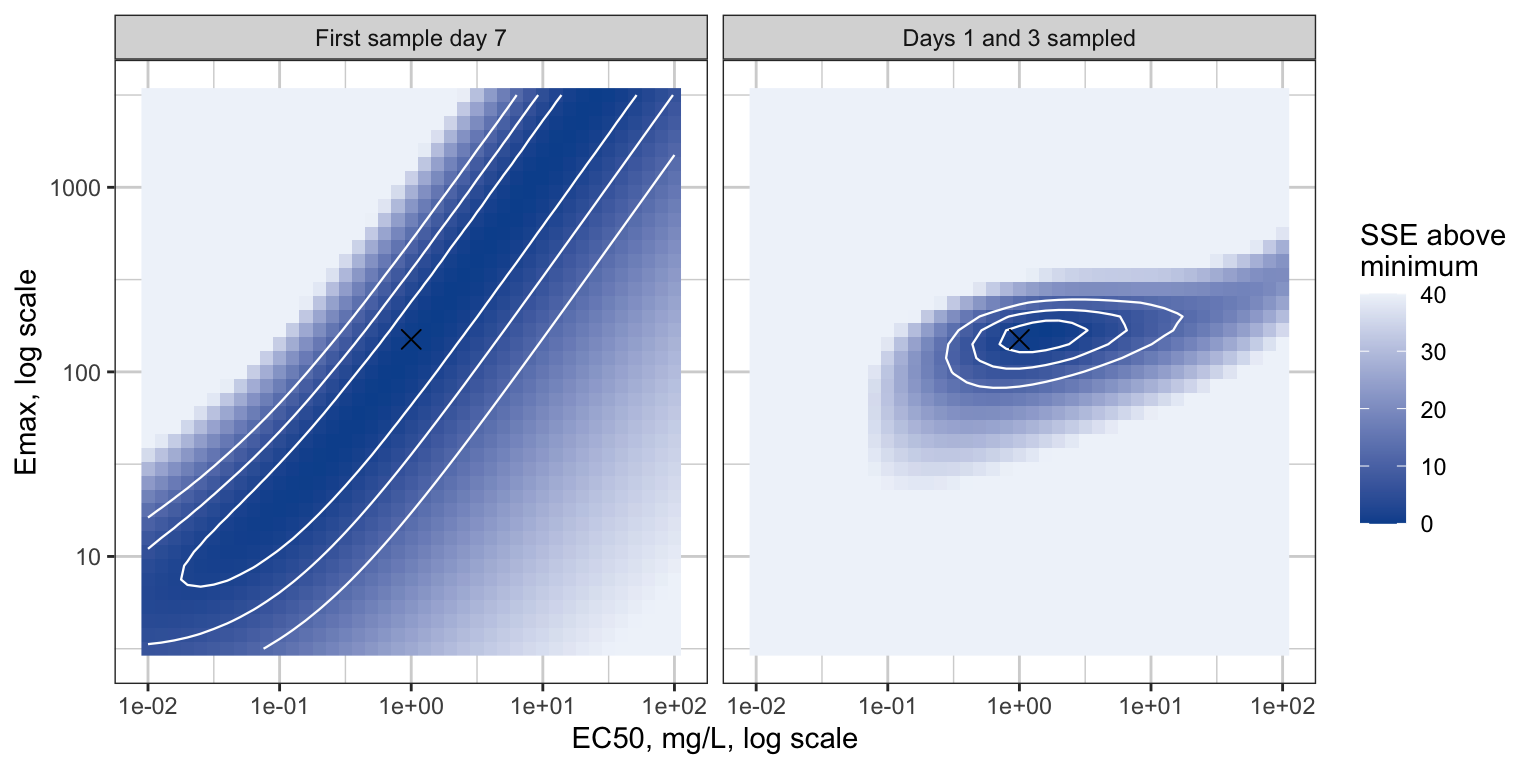
The ridge on the left is the line \(\log E_{\max} - \log EC_{50} =\) constant. Any fitting algorithm started on it stays on it, reports a converged \(E_{\max}\) and \(EC_{50}\) with enormous standard errors or none, and gives the right predictions inside the studied concentration range. That is the situation Dutta et al. described in 1996 for the sigmoid \(E_{\max}\) model with truncated data (references, entry 2): the fit is good, the descriptors inside the data are precise, and \(E_{\max}\) and \(EC_{50}\) are not.
8. What the published models found
| Drug, entry | Patients, doses | Drug effect form | What happened to \(EC_{50}\) | Reference |
|---|---|---|---|---|
| Ofatumumab, 5 | 1,486; 3 to 700 mg across five studies, including 3 and 10 mg arms with partial depletion | Sigmoid \(E_{\max}\) on lysis, within TMDD; \(K_D\) and \(k_{\rm off}\) fixed from preclinical data | Estimated: 0.0057 mg/L, RSE 8.5%; \(E_{\max}\) 159, RSE 3.2% | Yu et al., CNS Drugs 2022, doi |
| Rituximab, paediatric, 6 | 63; full dose; 281 CD19 counts, 52% below the limit | \(E_{\max}\) on degradation, driven by amount | Estimated: \(ED_{50}\) 0.69 mg, RSE 61%, CI 0.18 to 2.26; \(E_{\max}\) 155, CI 153 to 713; authors cite “the highly efficacious doses” | Pharmaceutics 2023;15:2534, doi |
| Inebilizumab, 7 | 213; 0.1 to 10 mg/kg and 30 to 600 mg, a 100-fold range | Log-linear slope on removal | Abandoned: “the estimated EC50 … was less than the assay lower limit of quantitation” | Yan et al., Br J Clin Pharmacol 2022, doi |
| Rituximab, membranous nephropathy, 8 | 41; 375 mg/m² × 4, 1000 mg × 2, 100 mg monthly | TMDD; elimination of the drug-CD20 complex | No \(EC_{50}\); binding constant \(k_{ss}\) at 60% RSE | PMC11002205 |
| Ianalumab, Sjögren’s, 9 | Phase 2 and RA data; 3 and 10 mg/kg single doses in the Phase 2 | Indirect-effect turnover; parameters not public | Not reported; a tissue receptor-occupancy model was added to carry the dose decision | Baltcheva et al., PAGE 2018, abstract |
Three of the five read directly against Sections 5 and 6. Ofatumumab is the case with cohorts in the band: the 3 mg and 10 mg subcutaneous arms gave partial and delayed depletion, subcutaneous absorption slows the fall so that weekly samples see it, and 1,486 patients did the rest. Rituximab at full dose is the ridge, with a 13-fold interval on \(ED_{50}\) and an upper bound on \(E_{\max}\) four times the estimate. Inebilizumab is the ridge recognized and dealt with: the estimator put \(EC_{50}\) below the PK assay, which is where Section 4 says the band is, and the authors fit the slope instead.
Two of the five took the route around the problem: fix the binding constant from in vitro measurements and let the model’s potency come from the literature rather than the data. That is a legitimate answer to “what is \(EC_{50}\)”, and it is not an estimate.
9. The slope parameterization
Schoemaker, van Gerven and Cohen showed in 1998 that when the data do not approach \(E_{\max}\), the parameter \(S_0 = E_{\max}/EC_{50}\), the initial slope of the \(E_{\max}\) curve, is estimable with good precision while its two factors are not, and proposed reporting it (references, entry 1). The inebilizumab model’s \(k = \text{slope} \cdot \log C\) is the same idea in a form that stays finite at high concentration.
For everything downstream of the B-cell count, the slope is enough. The duration of depletion, the time to repopulate to a fraction of baseline, depends on when \(E(C)\) falls to order 1, which is at \(C \approx 1/S_0\), and on \(k_{\rm out}\). Fitting the slope model and the \(E_{\max}\) model to the same sparse data and predicting the duration across the studied dose range:
trep <- function(dose, form = "emax", S = 0, Cref = 1) {
  tt <- seq(0, 500, by = 1)
  B <- sim_B(dose, Emax, EC50, kout, B0, times = tt, form = form, S = S, Cref = Cref)
  i <- which.min(B); j <- which(B[i:length(B)] >= 0.2 * B0)[1]; if (is.na(j)) NA else tt[i + j - 1]
}
Cref <- 0.1
S_match <- Emax / EC50 * Cref     # equal initial slope: S/Cref = Emax/EC50
dd <- 10^seq(-1.5, 2.5, length.out = 17)
tr <- bind_rows(
  data.frame(model = "Emax, EC50 (true)", dose = dd, trep = sapply(dd, trep)),
  data.frame(model = "Log-linear slope",  dose = dd, trep = sapply(dd, trep, form = "slope", S = S_match, Cref = Cref)))
ggplot(tr, aes(dose, trep, colour = model)) +
  annotate("rect", xmin = 3, xmax = 300, ymin = -Inf, ymax = Inf, alpha = 0.08, fill = "grey30") +
  geom_line(linewidth = 0.8) + geom_point(size = 1.8) +
  scale_colour_manual(values = pal3[1:2], name = NULL) +
  scale_x_log10() +
  annotate("text", x = 30, y = 20, label = "studied dose range", size = 3, colour = "grey40") +
  labs(x = "Dose, mg, log scale", y = "Days to repopulate to 20% of baseline") +
  theme(legend.position = "bottom")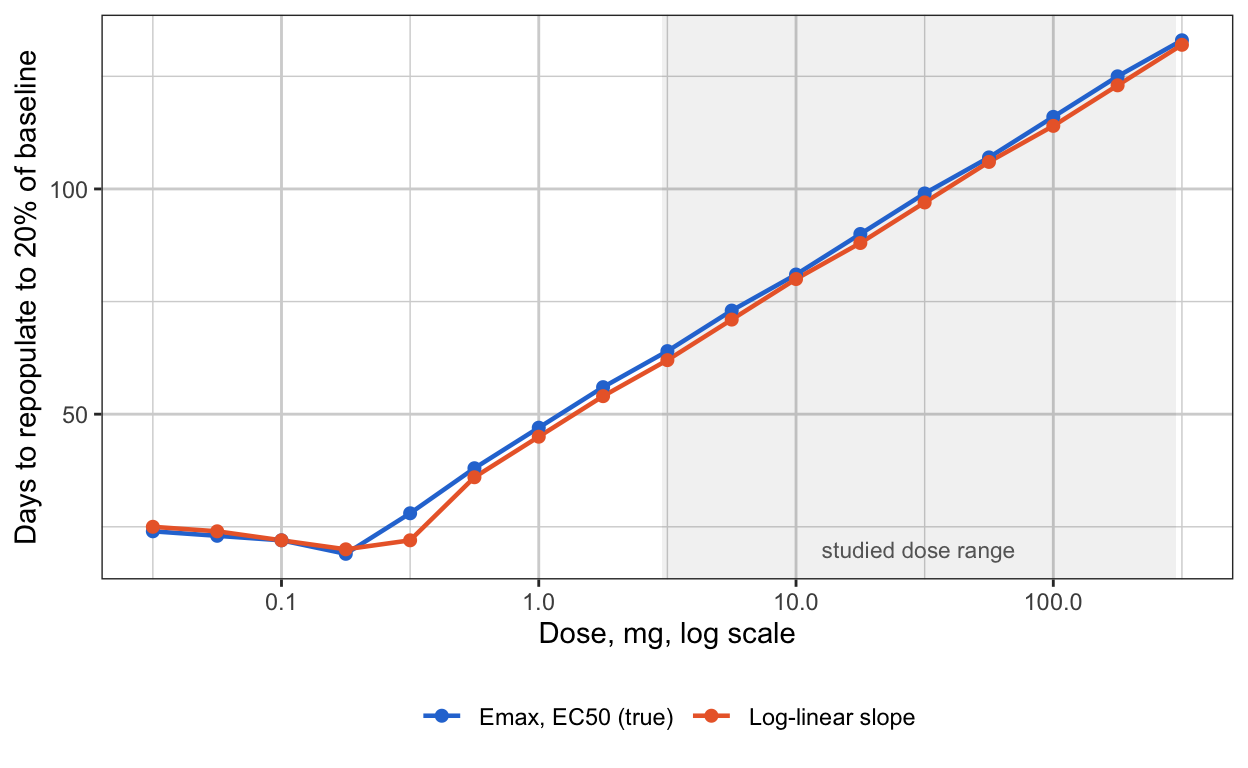
10. What a study needs if it wants EC50
Stated as requirements, in the order they would be dropped from a protocol.
- B-cell samples on days 1 and 3 after the first dose. The speed of the fall is the only observation that separates \(E_{\max}\) from \(EC_{50}\) at a therapeutic dose. With antibody-dependent lysis the fall is hours to days, and a first sample at a week arrives after it.
- B cells monthly until repopulation is complete in most patients. The tail identifies \(k_{\rm out}\), and without \(k_{\rm out}\) the fall identifies nothing.
- A PK assay whose limit is below \(EC_{50}/E_{\max}\), or a willingness to extrapolate the PK tail by a factor of a hundred and say so. Recovery starts at concentrations the assay may never see.
- A cohort at a dose whose nadir is quantifiable and whose concentration sits inside the band of Section 4, if the design can afford one. This is what ofatumumab had. A cohort below the band informs the slope and not the factors; a cohort above it is censored.
- Failing 1 and 4, fit the slope. Report \(S_0\) with its interval, state that \(E_{\max}\) and \(EC_{50}\) are identified as a ratio, and let anyone who needs the factors fix one of them from in vitro binding.
11. What this means for the ITP project
Section 6.2 of the ITP-PK-Platelet specification fits a B-cell layer to a dose escalation of three to six patients per level, first sample at a week, in order to carry the duration of depletion forward to a platelet model. Sections 5 and 6 here say that design identifies the slope and \(k_{\rm out}\) at a usable precision and identifies neither \(E_{\max}\) nor \(EC_{50}\); that Section 8 of the specification is right to parameterize by the slope; and that if the escalation protocol can add days 1 and 3, the \(E_{\max}\) form becomes fittable at about 10% RSE across five cohorts, at the cost of two blood draws.
12. Open questions
- Sigmoidicity. A Hill coefficient above 1 sharpens the band of Section 4 and makes the recovery start more abruptly. Whether it is identifiable alongside the slope at these designs has not been checked.
- Subcutaneous dosing. Absorption over days slows the fall and moves the information of Section 5’s first region into the first week, which is presumably part of why ofatumumab’s model could see it. The simulations here are intravenous.
- Censoring handled properly. Dropping observations below the limit throws away the statement that they are below it. A likelihood with censored terms would recover some information at the floor, and the comparison between designs is not expected to change.
- Between-patient variability. The Fisher information here is for a population with fixed parameters. With 50 to 126% CV on the recovery rate in published models, the precision numbers in Section 6 are optimistic by a factor that a population-design tool would give.