Platelet Kinetics Across ITP Therapies
Published figures show platelet-count trajectories in immune thrombocytopenia (ITP), from the first days after treatment to years of follow-up. The collection contains 20 source images: 14 with longitudinal platelet counts, four with response-duration information, one with B-cell recovery and one with dose history. Cross-trial efficacy ranking and quantitative curve fitting are outside this collection’s scope.
Each entry identifies the population and the plotted quantity. Time axes, summary statistics, rescue exclusions and the patients contributing late observations differ across figures. A mean or median curve can hide individual fluctuations; response-survival curves describe how long a response lasts. Study regimens below identify the evidence being shown.
For the dose-selection question in the working specification, look for counts maintained after treatment withdrawal and during immune recovery. The working hypothesis allows healthy naive B cells to return after a reset. Total peripheral B-cell depletion duration alone cannot establish that reset; these figures do not validate an immunophenotype as a surrogate for durable ITP control.
Figure Index
| Modality | Figures | Main view |
|---|---|---|
| B-cell depletion | Rituximab | Long-term counts, response persistence, B-cell recovery |
| TPO pathway | Romiplostim, avatrombopag, eltrombopag, recombinant TPO | Counts during treatment and dose adjustment |
| Rapid immunomodulation | Intravenous immunoglobulin and anti-D | Early counts and repeated individual treatment episodes |
| Corticosteroids | Dexamethasone followed by prednisone | Response persistence; early count kinetics still missing |
| FcRn inhibition | Efgartigimod, rozanolixizumab | Counts with IgG changes or repeated dosing |
| Signalling inhibitors | Rilzabrutinib, fostamatinib | Overall and responder-conditioned counts |
| Plasma-cell targeting | CM313 anti-CD38 | Early counts and individual response categories |
| Splenectomy | Adult and pediatric cohorts | Early peaks and longer individual courses |
B-cell Depletion
Rituximab: platelet counts after a four-dose course
Count trajectory. Adults with chronic/refractory ITP; 18 treated with 375 mg/m² weekly for four doses.
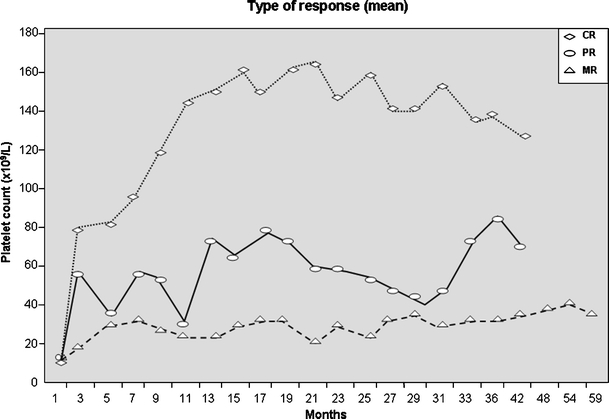
Curves are grouped by response category, not randomized dose. The image labels them means, whereas the article text calls them medians. The month labels are unequally spaced in time but equally spaced on the plot; do not estimate slopes from visual distance.
Source: Jaime Garcia-Chavez et al. (2007), Rituximab therapy for chonic and refractory immune thrombocytopenic purpura: a long-term follow-up analysis, Figure 1 and original legend.
Reuse status: Publisher copyright; no explicit open reuse licence identified on the retrieved article.
Rituximab: years of response after treatment
Response-duration context. Selected initial responders; adult inclusion required response lasting at least one year.
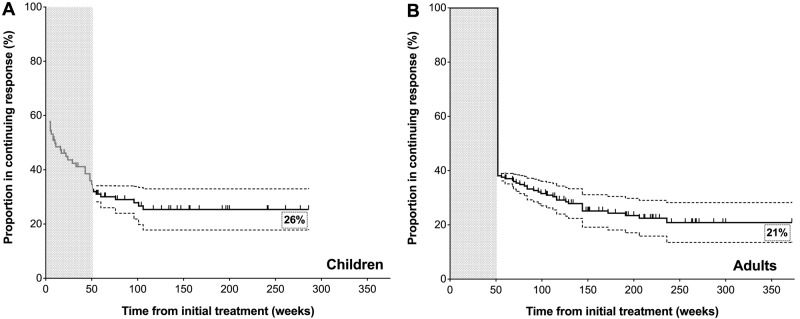
These response-survival projections incorporate published first-year response estimates, followed by the selected cohort’s longer follow-up. They are not platelet counts or a single all-treated cohort. Adult and pediatric selection differs.
Source: Vivek L Patel et al. (2012), Outcomes 5 years after response to rituximab therapy in children and adults with immune thrombocytopenia, Figure 2 and original legend.
Reuse status: Publisher copyright; no explicit open reuse licence identified on the retrieved article.
Rituximab: B-cell recovery alongside the durability question
Immune-recovery context. B-cell trajectories in a selected subset of initial ITP responders.
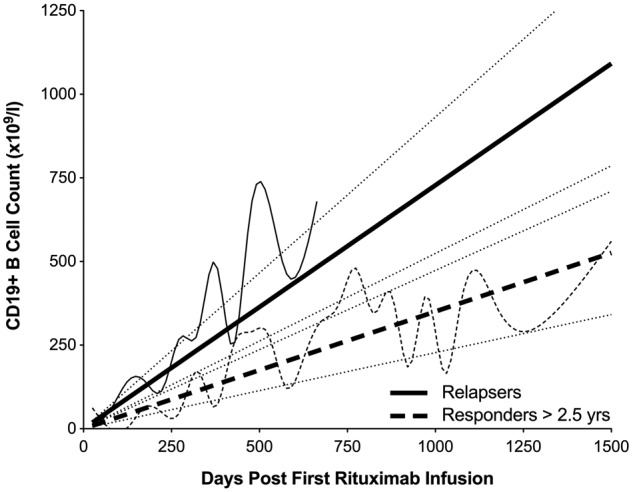
B-cell recovery in selected initial responders accompanies the durability analysis. The plotted count scale and printed unit need reconciliation before digitization. The association does not establish a dose effect or distinguish naive-cell recovery from pathogenic-cell return.
Source: Vivek L Patel et al. (2012), Outcomes 5 years after response to rituximab therapy in children and adults with immune thrombocytopenia, Figure 3 and original legend.
Reuse status: Publisher copyright; no explicit open reuse licence identified on the retrieved article.
TPO Pathway
Thrombopoietin receptor agonists (TPO-RAs) include romiplostim, avatrombopag and eltrombopag. The active-comparator study also includes recombinant human thrombopoietin (rhTPO).
Romiplostim: platelet counts through 24 weeks
Count trajectory. Routine-practice adult cohort, separated by disease duration at treatment initiation.
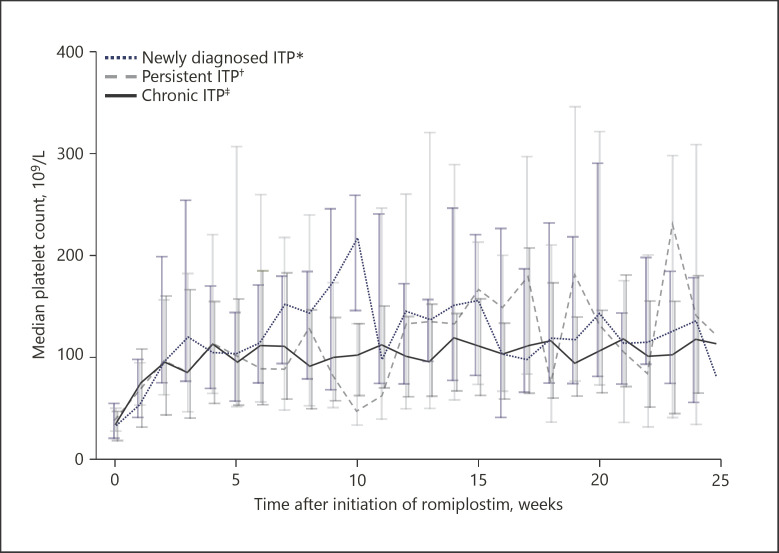
Unweighted medians show longitudinal counts; interpret the medians alongside follow-up availability and dose titration. Disease-phase groups are not randomized regimens.
Source: Marcel Reiser et al. (2021), Romiplostim for Primary Immune Thrombocytopenia in Routine Clinical Practice: Results from a Multicentre Observational Study in Germany, Figure 4 and original legend.
Reuse status: Reuse licence not resolved from the retrieved article; consult source copyright notice.
Romiplostim: the dosing trajectory behind those counts
Dose context. Same routine-practice cohort as the platelet plot above.
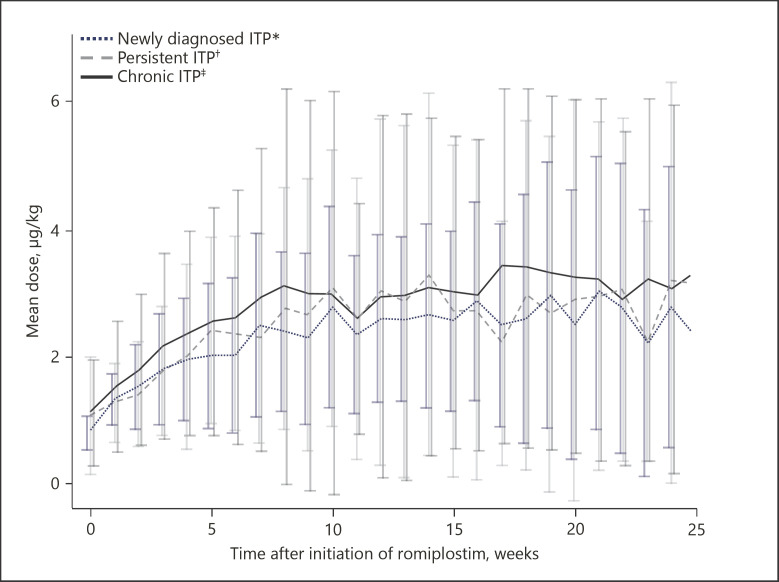
Mean weekly dose helps interpret the apparent count plateau. Response-guided dosing means exposure is partly a consequence of earlier counts.
Source: Marcel Reiser et al. (2021), Romiplostim for Primary Immune Thrombocytopenia in Routine Clinical Practice: Results from a Multicentre Observational Study in Germany, Figure 3 and original legend.
Reuse status: Reuse licence not resolved from the retrieved article; consult source copyright notice.
Avatrombopag: early rise, core study and extension
Count trajectory. Randomized adult chronic-ITP study, starting at 20 mg/day; core study and open-label extension.
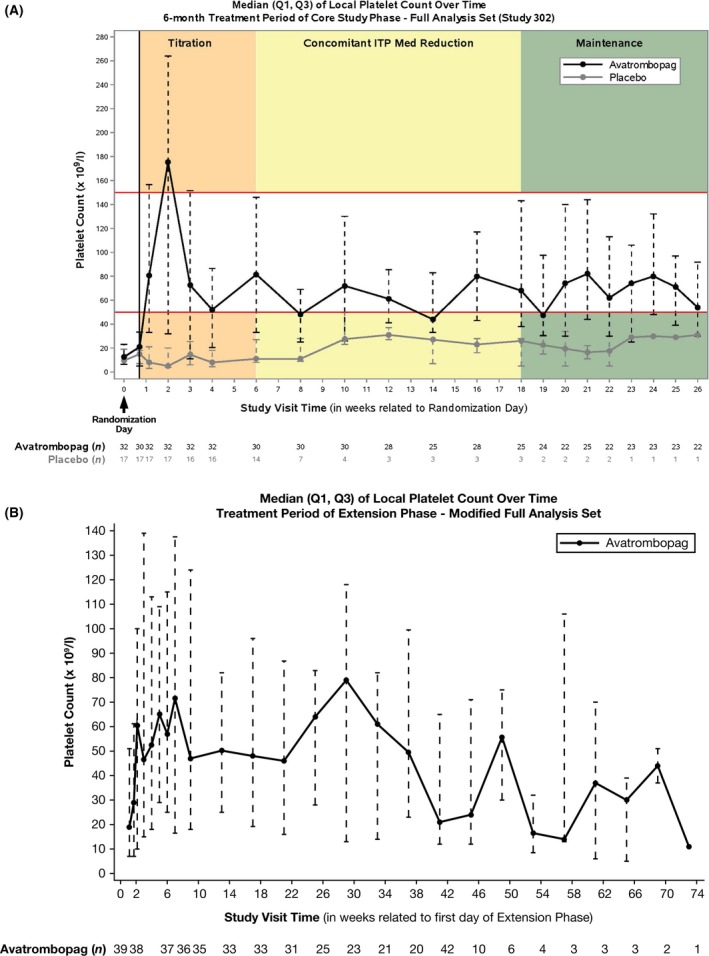
Medians and quartiles retain spread. Read the numbers observed and the change to the extension population; later values do not represent an unchanged randomized cohort.
Source: Wojciech Jurczak et al. (2018), Phase 3 randomised study of avatrombopag, a novel thrombopoietin receptor agonist for the treatment of chronic immune thrombocytopenia, Figure 3 and original legend.
Reuse status: CC BY-NC 4.0
Eltrombopag versus dose-optimized recombinant TPO
Count trajectory. TE-ITP randomized active-comparator study in adults.
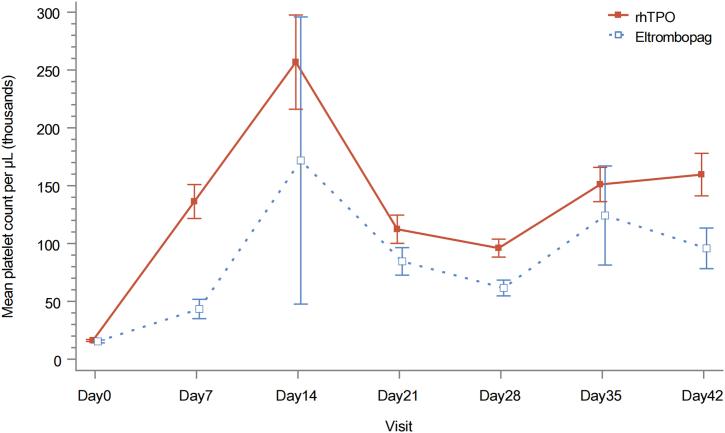
Mean counts with standard errors show a direct within-study comparison. The interventions are treatment strategies with dose management, not equivalent fixed doses.
Source: Yunfei Chen et al. (2025), Dose-optimised recombinant human thrombopoietin versus eltrombopag in patients with immune thrombocytopenia: a multicenter, randomised controlled trial (The TE-ITP Study), Figure 3 and original legend.
Reuse status: CC BY 4.0
Rituximab, TPO-RAs and oral immunosuppressants in children
Count trajectory at discrete visits. ICON1 prospective observational study of children starting second-line therapy.
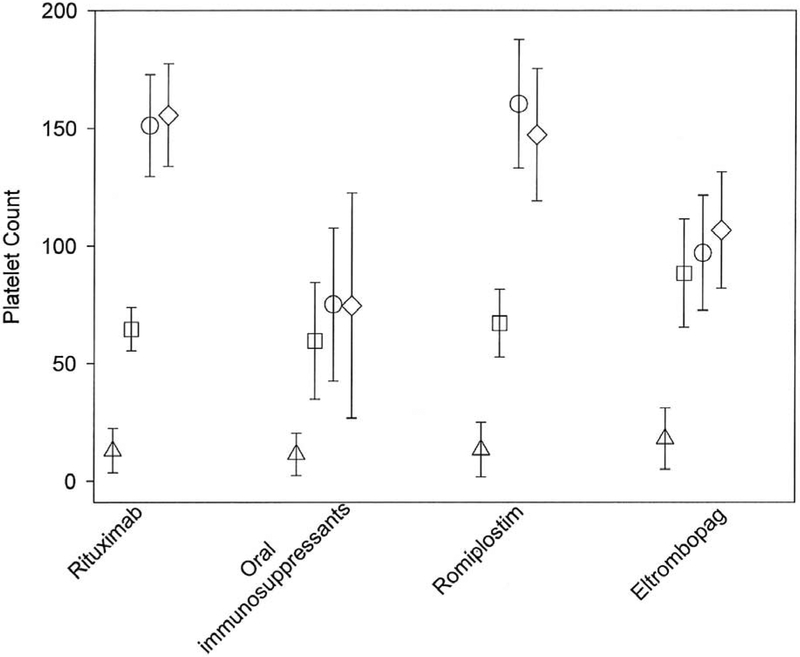
This source image is panel A alone. Medians are shown at baseline (triangles), 1 month (squares), 6 months (circles), and 12 months (diamonds). Treatment assignment was not randomized; pediatric results should not be substituted for adult ITP.
Source: Rachael F Grace et al. (2019), Second-Line Treatments in Children with Immune Thrombocytopenia: Effect on Platelet Count and Patient-Centered Outcomes, Figure 1A and original legend.
Reuse status: Author manuscript; no explicit open reuse licence identified on the retrieved article.
Rapid Immunomodulation
Intravenous immunoglobulin (IVIg) and anti-D immunoglobulin figures resolve early treatment episodes. The production marker shown below is the absolute immature platelet fraction (A-IPF), expressed as a count of immature platelets.
IVIg: early rise and subsequent decline
Count trajectory. Panzyga chronic-ITP study; full analysis set of 36 patients.
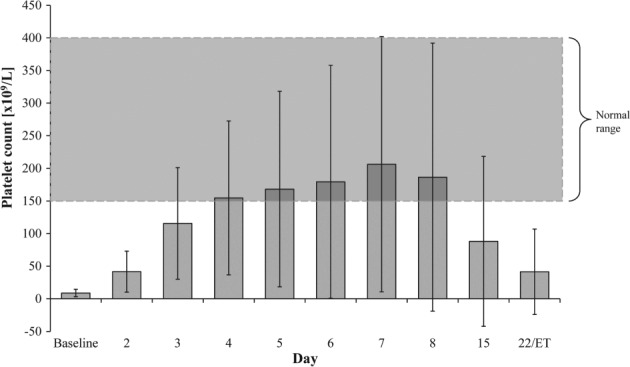
A short-timescale platelet course useful for recognizing a rescue-treatment contribution. ET denotes early termination, not a common scheduled late timepoint.
Source: O Arbach et al. (2019), Efficacy and safety of a new intravenous immunoglobulin (Panzyga®) in chronic immune thrombocytopenia, Figure 1 and original legend.
Reuse status: CC BY 4.0
IVIg and anti-D: repeated individual treatment episodes
Individual count trajectory with production marker. Selected patients with repeated anti-D or IVIg treatment episodes.
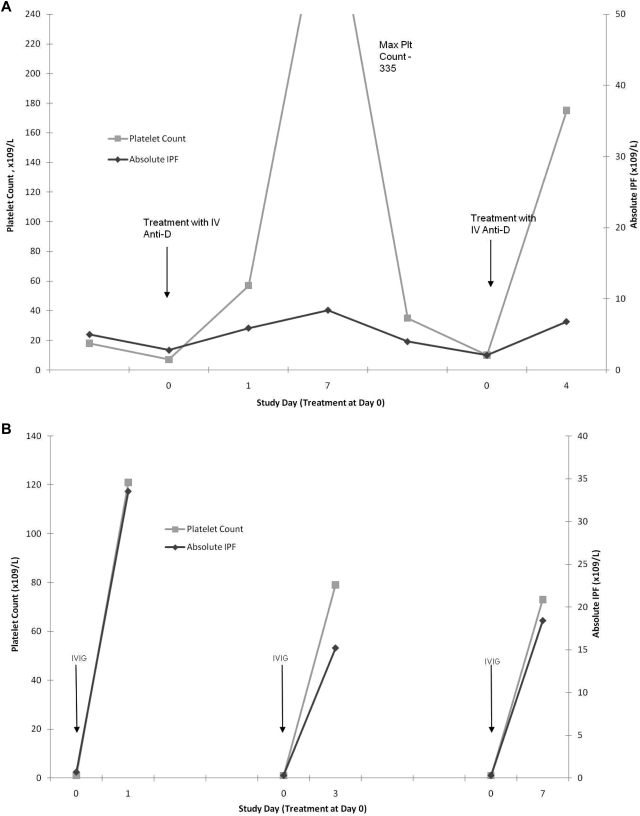
Platelets and absolute immature platelet counts are shown together. Within-patient recurrence is informative, but selected examples are not a population response distribution.
Source: Sarah J Barsam et al. (2011), Platelet production and platelet destruction: assessing mechanisms of treatment effect in immune thrombocytopenia, Figure 4 and original legend.
Reuse status: Publisher copyright; no explicit open reuse licence identified on the retrieved article.
Corticosteroids
Dexamethasone followed by prednisone: persistence of response
Response-duration context. Newly diagnosed adults treated with high-dose dexamethasone followed by prednisone maintenance.
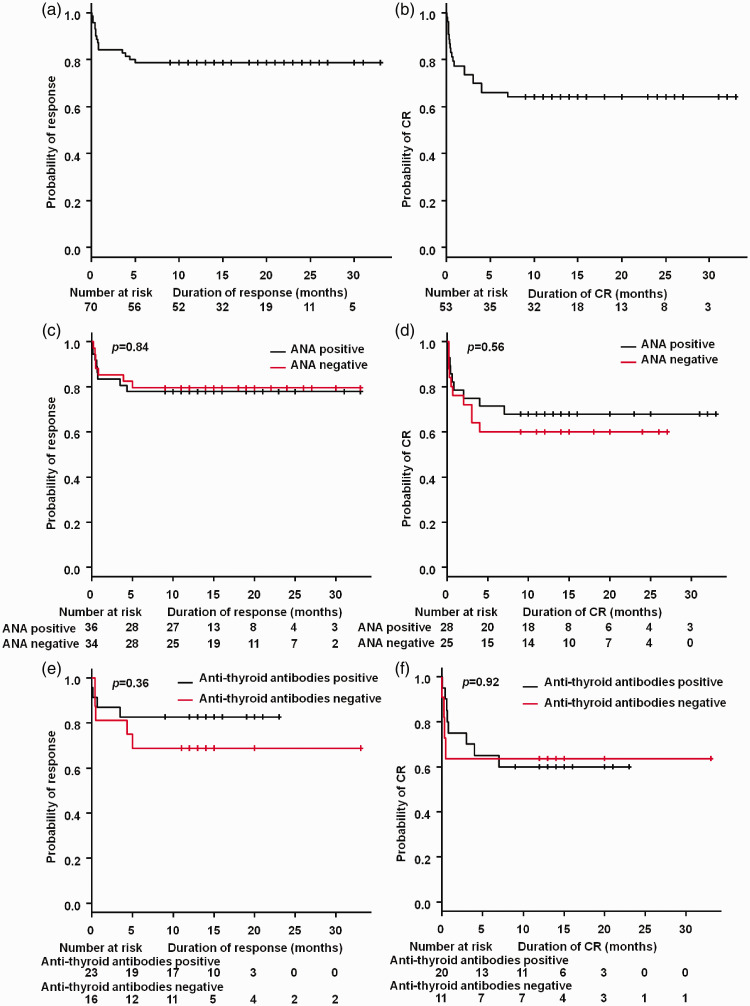
Response-survival curves among initial responders, not raw platelet trajectories. This combination cannot isolate a four-day dexamethasone effect; an early platelet-count figure remains a requested addition.
Source: Jin Xu et al. (2021), Clinical efficacy of high-dose dexamethasone with sequential prednisone maintenance therapy for newly diagnosed adult immune thrombocytopenia in a real-world setting, Figure 2 and original legend.
Reuse status: CC BY-NC 4.0
FcRn Inhibition
FcRn is the neonatal Fc receptor. The efgartigimod figure places platelet counts alongside immunoglobulin G (IgG), providing a view of the pharmacodynamic marker and clinical measurement on the same timeline.
Efgartigimod: platelets and IgG on the same timeline
Count trajectory with IgG and bleeding. Randomized Phase 2 ITP study comparing placebo and 5 or 10 mg/kg, with four weekly infusions.
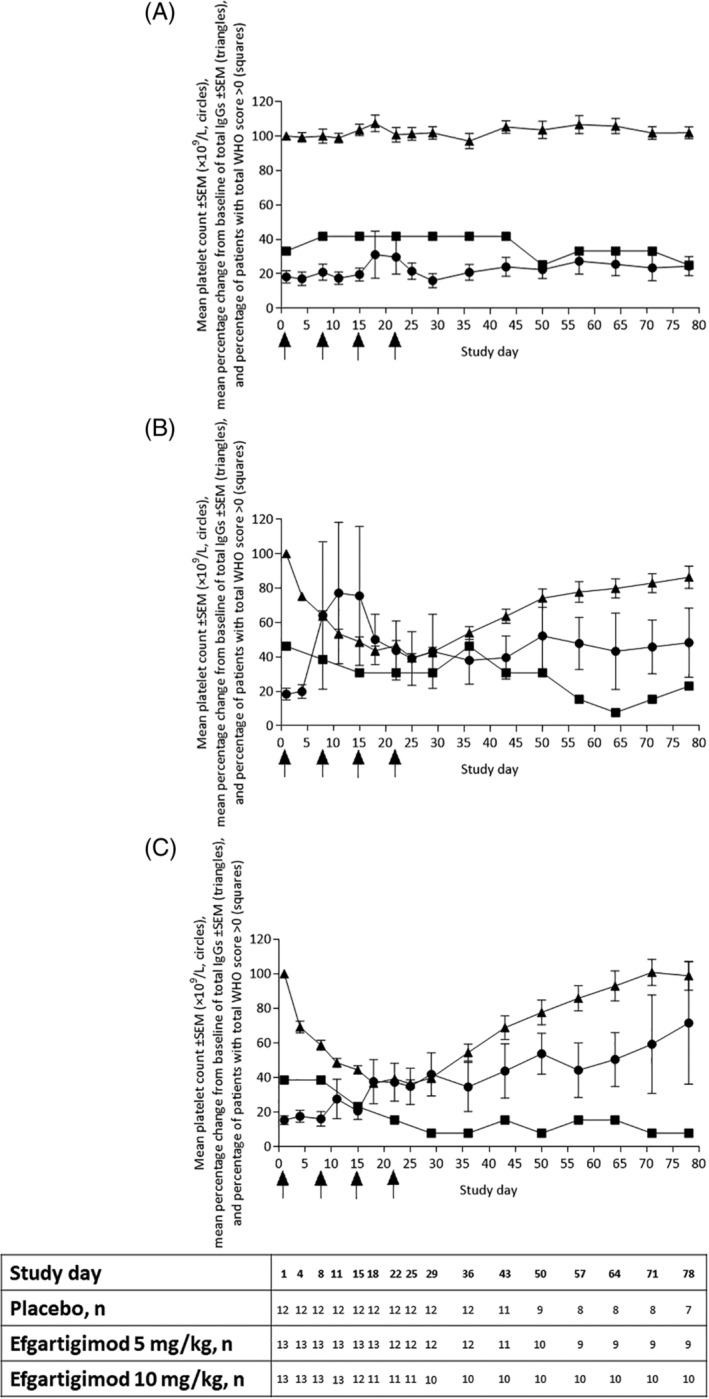
Circles show mean platelets and triangles the IgG readout; arrows mark infusions. The caption calls IgG a percentage change, but the plotted baseline is near 100; check that convention before extracting values. Post-rescue observations are excluded.
Source: Adrian C Newland et al. (2019), Phase 2 study of efgartigimod, a novel FcRn antagonist, in adult patients with primary immune thrombocytopenia, Figure 2 and original legend.
Reuse status: CC BY-NC-ND 4.0
Rozanolixizumab: placebo-controlled periods and extension
Count trajectory. Two randomized ITP studies and their open-label extension.
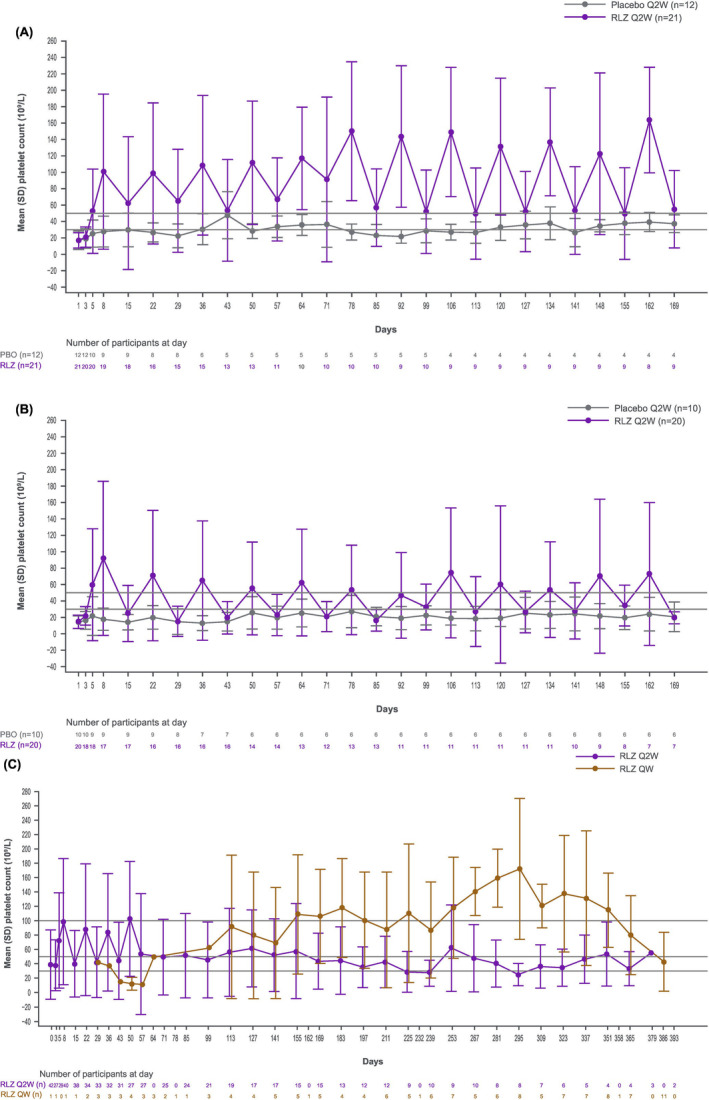
Mean counts and SD are shown with sample sizes. Post-rescue observations are excluded; extension dosing schedules and participants differ from the blinded periods.
Source: Nichola Cooper et al. (2024), Inhibition of FcRn with rozanolixizumab in adults with immune thrombocytopenia: Two randomised, double‐blind, placebo‐controlled phase 3 studies and their open‐label extension, Figure 1 and original legend.
Reuse status: CC BY 4.0
Signalling Inhibitors
Rilzabrutinib inhibits Bruton tyrosine kinase (BTK); fostamatinib inhibits spleen tyrosine kinase (SYK).
Rilzabrutinib: overall and responder-conditioned trajectories
Count trajectory with subgroup analysis. LUNA3 randomized adult persistent/chronic-ITP trial; 400 mg twice daily versus placebo.
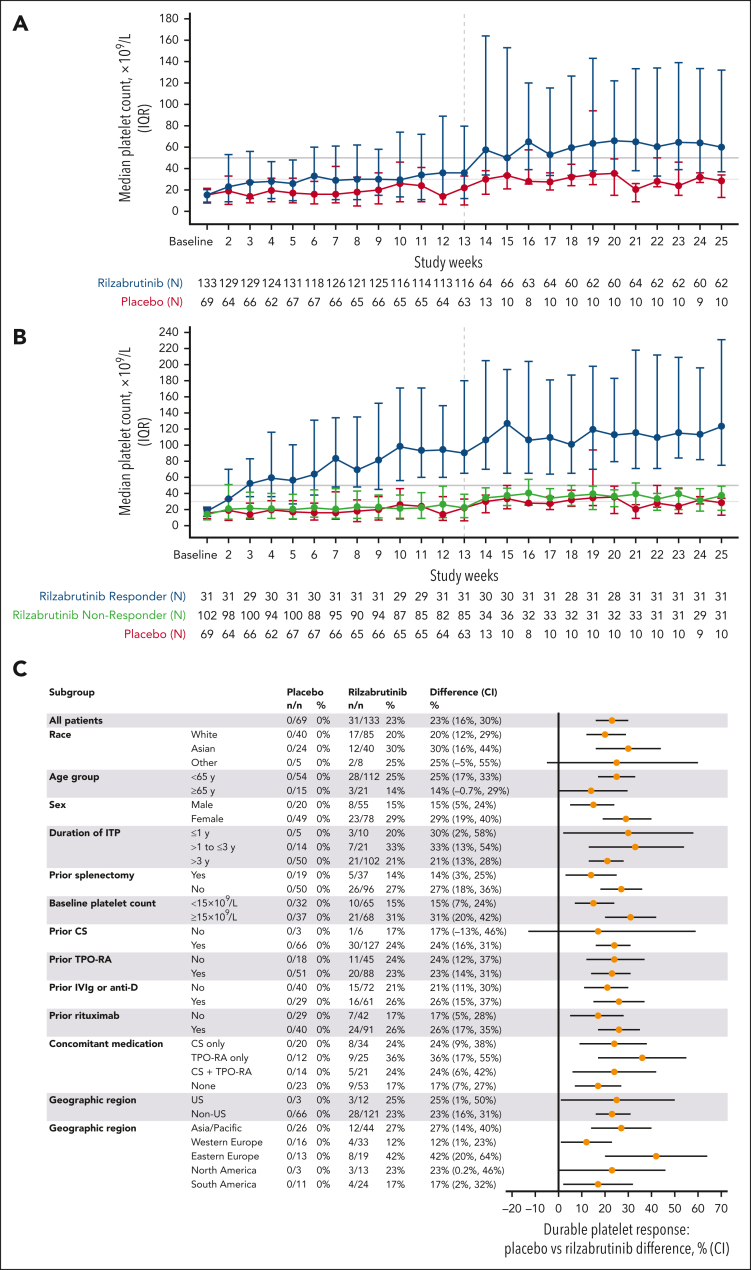
Panels A and B show medians and IQR. Continuation after week 12 depended on response, and panel B conditions on response status; late separation is not a simple fixed-cohort exposure effect.
Source: David J Kuter et al. (2025), Safety and efficacy of rilzabrutinib vs placebo in adults with immune thrombocytopenia: the phase 3 LUNA3 study, Figure 2 and original legend.
Reuse status: CC BY-NC-ND 4.0
Fostamatinib: platelet trajectories by response classification
Count trajectory. Pooled FIT1/FIT2 trials; starting 100 mg twice daily, with escalation to 150 mg twice daily in nonresponders.
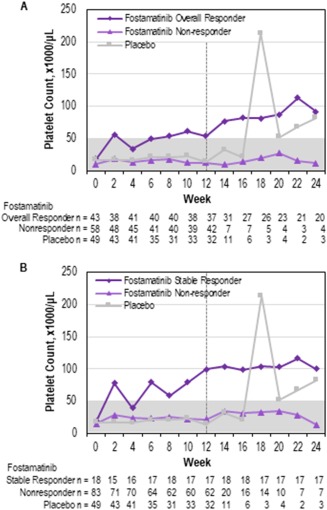
Both panels condition on response classification. The week-12 boundary permits nonresponders to enter extension; these are not unselected randomized-arm medians throughout.
Source: James Bussel et al. (2018), Fostamatinib for the treatment of adult persistent and chronic immune thrombocytopenia: Results of two phase 3, randomized, placebo‐controlled trials, Figure 2 and original legend.
Reuse status: CC BY-NC 4.0
Fostamatinib: patient-level treatment and response duration
Response-duration context. Selected second-line fostamatinib responders.
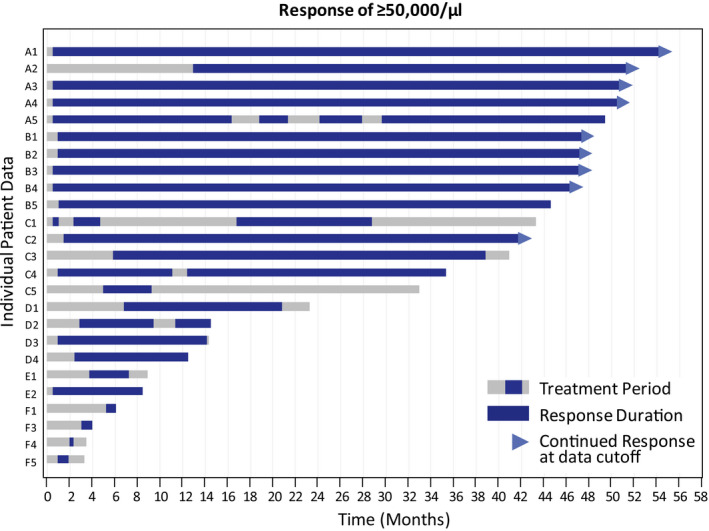
Swimmer lanes separate treatment duration from maintained response. Nonresponders are omitted, so this is a view of heterogeneity among responders rather than response probability.
Source: Ralph Boccia et al. (2020), Fostamatinib is an effective second‐line therapy in patients with immune thrombocytopenia, Figure 2 and original legend.
Reuse status: CC BY-NC-ND 4.0
Plasma-cell Targeting
The static CM313 figures are accompanied by links to the publisher’s interactive graphics, which contain additional views.
CM313 anti-CD38: early platelet trajectory
Count trajectory. Randomized Phase 2 trial in adults with persistent/chronic primary ITP.
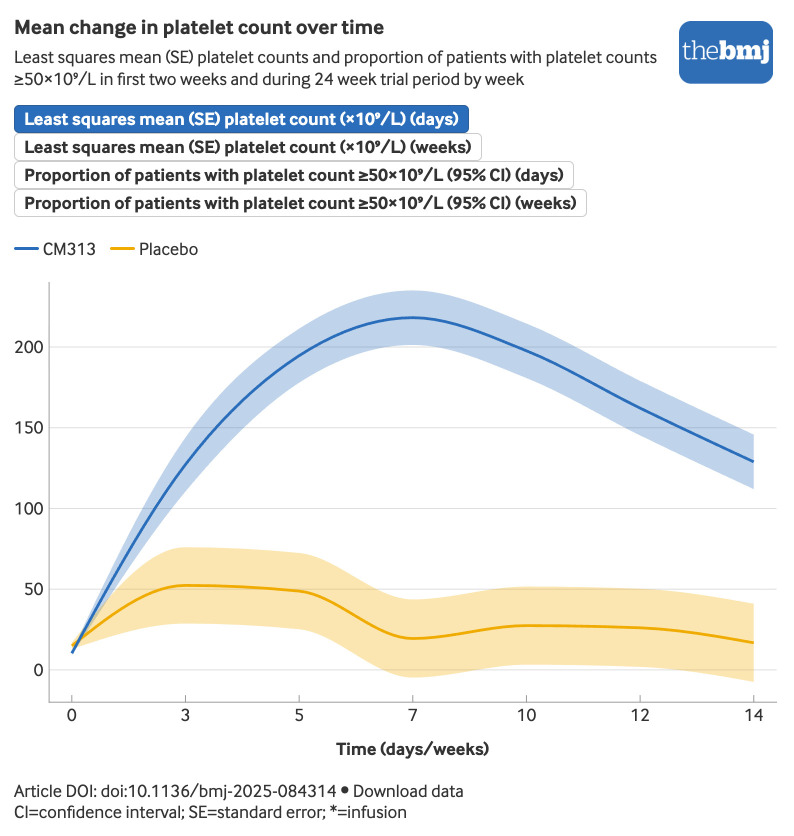
The downloaded static figure shows the first 14 days of least-squares mean platelet counts with SE bands. The labels at the top are tabs in the interactive original, not additional panels in this JPEG; use the interactive link for the 24-week and response-proportion views.
Source: Yunfei Chen et al. (2025), Anti-CD38 monoclonal antibody CM313 for primary immune thrombocytopenia: multicentre, randomised, placebo controlled, phase 2 trial, Figure 2 and original legend.
Open image at full size · Interactive source figure.
Reuse status: CC BY-NC 4.0
CM313 anti-CD38: response patterns for individual patients
Response-duration context. Same CM313 trial; individual lanes include response categories and concomitant treatment.
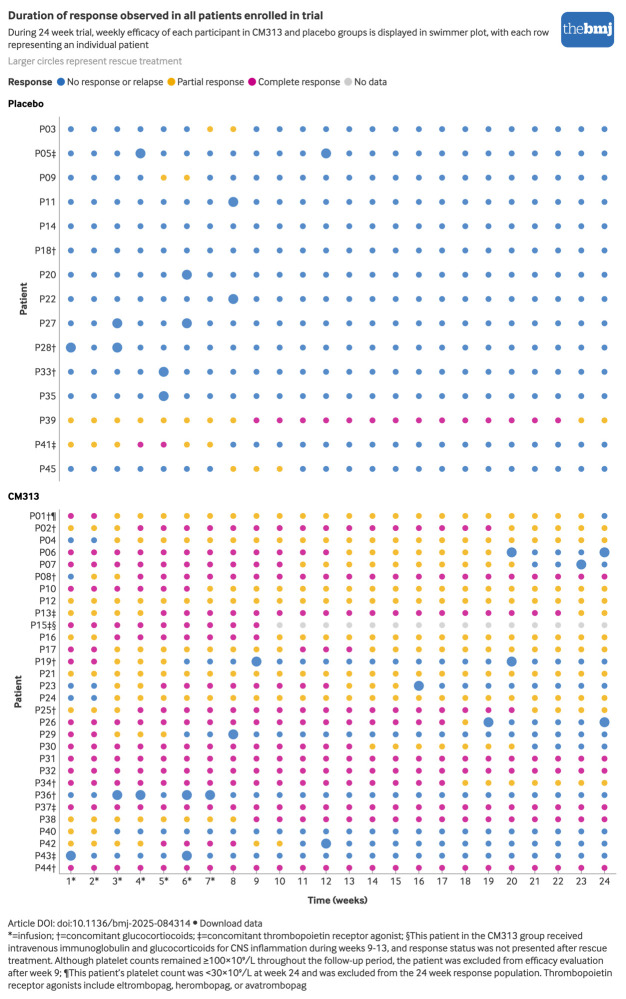
Each row follows one patient through 24 weeks; colours classify response and larger dots mark rescue. Post-rescue data are classified as nonresponse, with one patient’s later status omitted. The article caption describes red bars, but the static image uses coloured dots; use its visible legend.
Source: Yunfei Chen et al. (2025), Anti-CD38 monoclonal antibody CM313 for primary immune thrombocytopenia: multicentre, randomised, placebo controlled, phase 2 trial, Figure 3 and original legend.
Open image at full size · Interactive source figure.
Reuse status: CC BY-NC 4.0
Splenectomy
Splenectomy: early rise and one-year follow-up
Count trajectory. Retrospective cohort including primary and secondary ITP, grouped by postsplenectomy TPO-RA use.
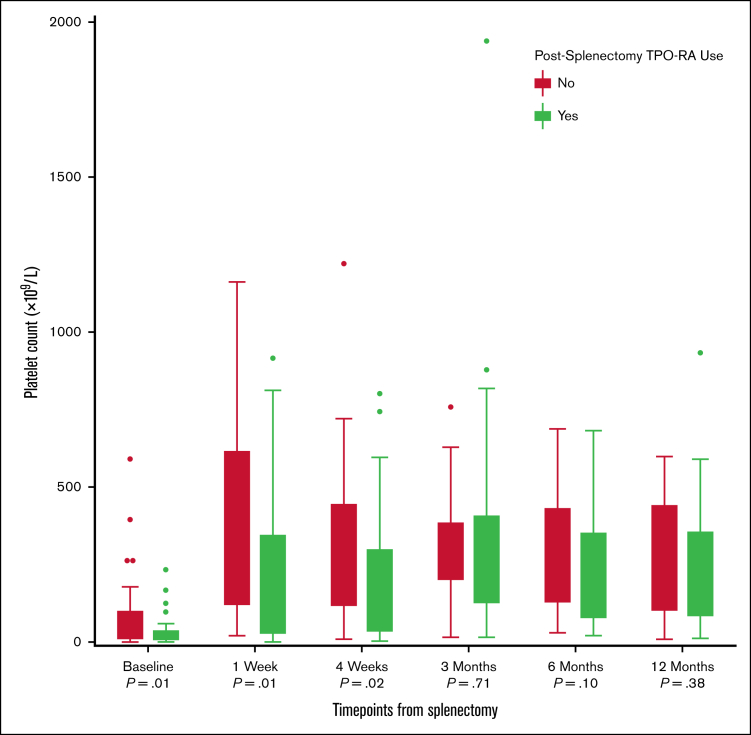
Box plots show baseline, 1 and 4 weeks, and 3, 6 and 12 months. TPO-RA use was related to inadequate response; the groups do not estimate a randomized TPO-RA effect. Time intervals are unequal.
Source: Ruah Alyamany et al. (2025), Beyond platelet counts: assessing safety of postsplenectomy TPO-RA use in ITP, Figure 4 and original legend.
Reuse status: CC BY-NC-ND 4.0
Splenectomy in children: individual platelet trajectories
Individual count trajectories. Pediatric international registry of splenectomy in ITP.
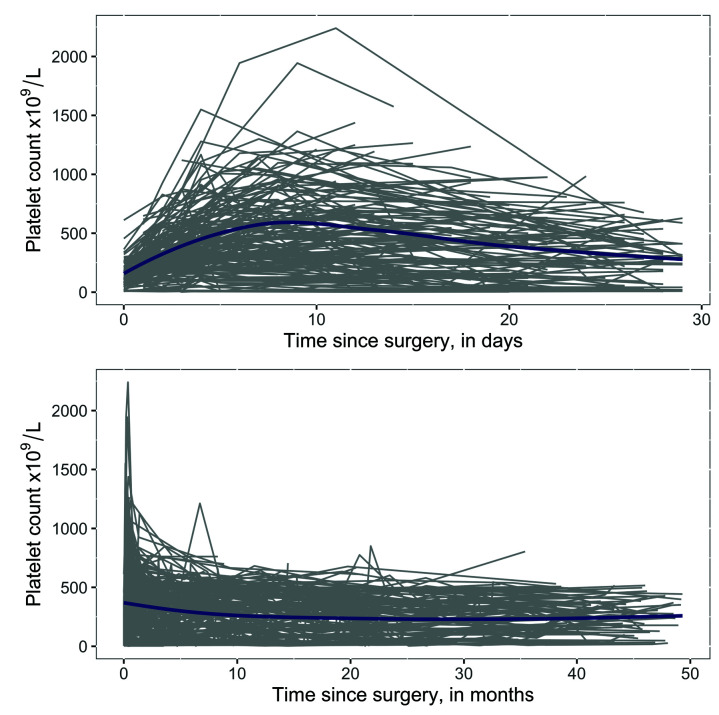
Individual curves show the first 30 days and approximately 50 months. The blue line is a loess smooth, not a representative patient. Large early peaks and differing late courses illustrate what a group summary hides.
Source: Maria L Avila et al. (2019), Long-term outcomes after splenectomy in children with immune thrombocytopenia: an update on the registry data from the Intercontinental Cooperative ITP Study Group, Figure 1 and original legend.
Reuse status: CC BY-NC 4.0
Figures to Add
| Paper or gap | Access status | Useful images to supply |
|---|---|---|
| Ianalumab plus eltrombopag, VAYHIT2 | Publisher full text returned HTTP 403 during collection | Platelet-count trajectories during eltrombopag taper and subsequent follow-up, if present in the paper or supplement; paired B-cell recovery or immunophenotype plots, if available |
| Mezagitamab randomized Phase 2 trial | Publisher full text returned HTTP 403 during collection | Platelet counts by dose through treatment and follow-up; individual courses and the treatment schedule |
| Early corticosteroid count trajectories | A suitable image was not located in the accessible papers checked; the figure above covers persistence | Daily or weekly counts after dexamethasone or prednisone, with repeat courses, taper and rescue marked |
| Paired B-cell phenotype and platelet trajectories | A directly aligned ITP example was not located | Individual counts alongside naive, memory and other relevant B-cell subsets, including treatment-free follow-up; tissue measurements where available |
Images can be placed in platelet-kinetics-images/uploads/. Include the paper or DOI, figure number and original legend, especially the regimen, time origin, rescue rules and whether the plot includes only responders. The upload notes give a short template.
Sources and Image Files
Images were retrieved on 14 September 2026 and visually checked against their linked figure descriptions. Local files retain the original source JPEGs; only the display size changes. Entry notes are written for this collection. The source manifest records source and image URLs, DOI, retrieval date, reuse status and a SHA-256 checksum for each file. Third-party figures retain their own copyright and licence terms.
Several source inconsistencies are recorded at the affected figures: the rituximab mean/median description and B-cell units, the efgartigimod IgG convention, and the CM313 static-versus-interactive presentation. These need resolution with the source before numerical extraction. No curves were digitized or fitted for this collection.
Suggested First Figures
- Avatrombopag: count kinetics with dose adjustment, concomitant-medication reduction and changing follow-up numbers visible.
- IVIg and anti-D individual episodes: early treatment effects and recurrence within a patient.
- Rituximab recovery: the immune-recovery association that needs phenotype information before it can address the reset hypothesis.
- Rilzabrutinib: how response-dependent continuation changes the late group trajectory.
- Pediatric splenectomy trajectories: individual variation alongside a smoothed population course.